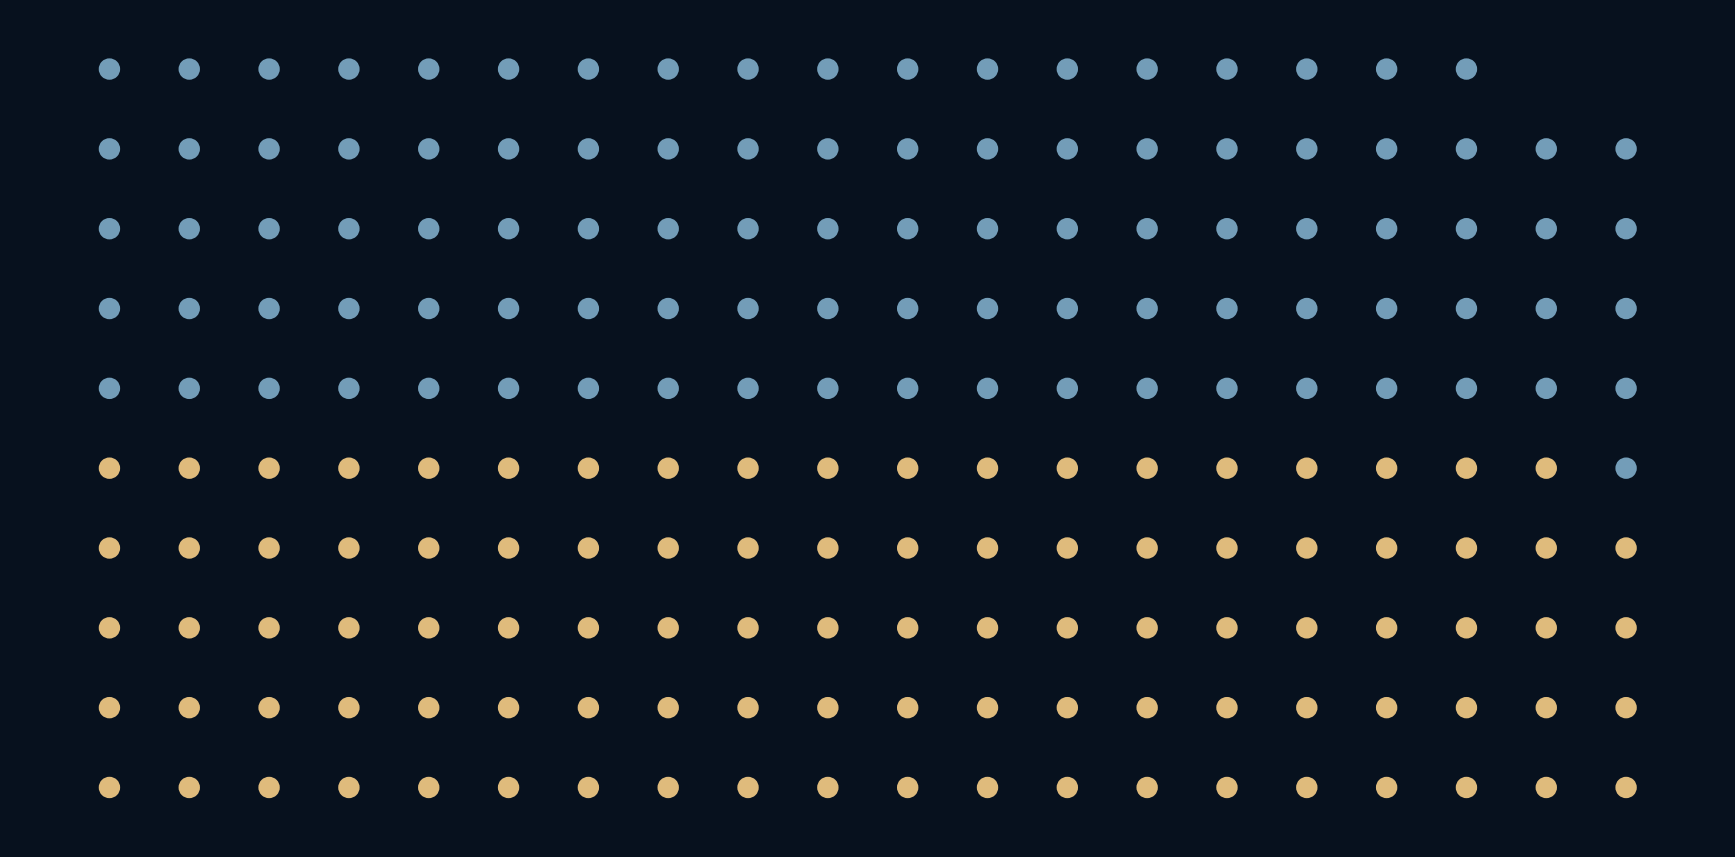
An alarm can catch 99% of events and still produce as many false alerts as true ones.
Suppose a fictional detector screens 10,000 cases. Exactly 100 contain the event it is looking for. The detector catches 99% of those events and correctly stays quiet on 99% of cases without one. Both percentages sound reassuring. Counting what reaches the alert tray reveals a different percentage: only half the alerts correspond to real events.
An alert inherits the rarity of the thing it is trying to find.
Accuracy needs a denominator
Sensitivity asks what fraction of actual events trigger an alert. Specificity asks what fraction of non-events stay quiet. Neither directly answers the question someone asks when an alert appears: what fraction of alerts are real? That last fraction uses the alert tray as its denominator, not the original event or non-event group.
For this example, there are 100 events and 9,900 non-events. A sensitivity of 99% yields 99 true alerts and one missed event. A specificity of 99% means 1% of the much larger non-event group still alerts. That creates 99 false alerts. The same percentage error operates on a very different-sized pool.
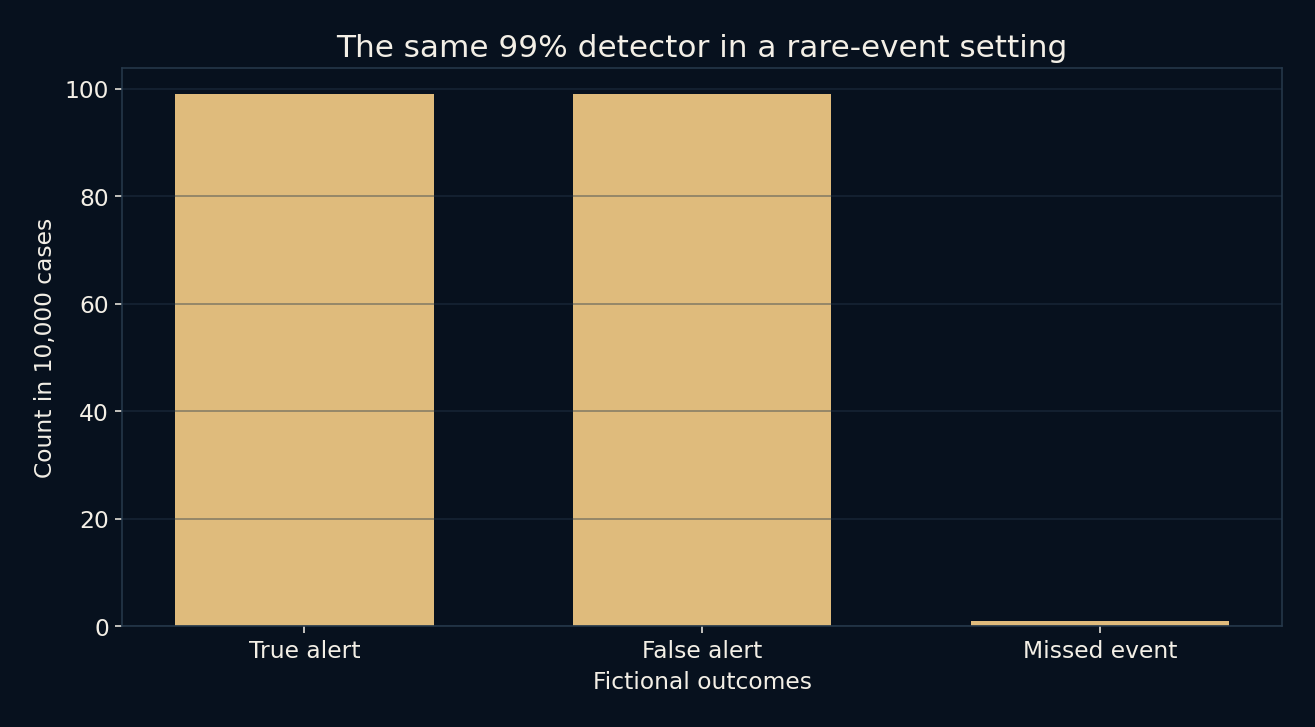
Half of the alerts are real
The tray contains 198 alerts: 99 true and 99 false. Dividing 99 by 198 gives 50%. This quantity is often called positive predictive value. It is compatible with both sensitivity and specificity being 99%. There is no contradiction because the calculations condition on different groups.
The 9,801 correctly quiet non-events still matter. The detector has not suddenly become useless, and this example does not tell us whether using it is worthwhile. That decision depends on what an alert costs, what a missed event costs, and what happens next. A follow-up review might be cheap in one setting and disruptive in another.
Rarer events make false alerts loom larger
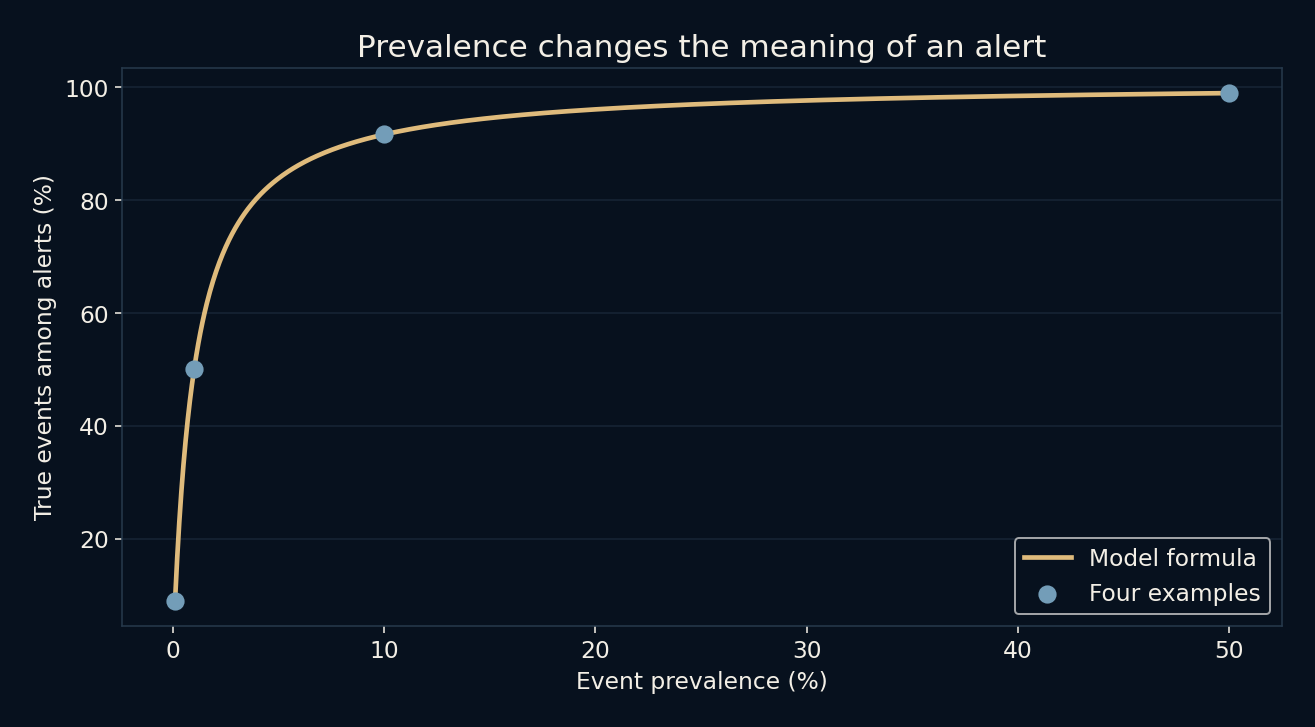
Keep sensitivity and specificity fixed at 99%, but reduce event prevalence to 0.1%. The expected fraction of alerts that are real falls to about 9.016%. Now most alerts are false even though the detector’s two stipulated rates have not changed. At 10% prevalence, the corresponding fraction is about 91.667%; at 50%, it reaches 99%.
Those comparisons use the probability formula, not four new field studies. Its numerator is sensitivity times prevalence. Its denominator adds that same quantity to the false-positive rate times one minus prevalence. Writing the count story first makes the formula less mysterious: genuine and false alerts both enter the tray, from populations of very different sizes.
An alert should lead to an appropriate next step
The natural response is to interpret the alert in context rather than blindly trust or dismiss it. A real decision may require a second source of evidence, a careful review or a clearly defined escalation process. This article does not prescribe one because the detector and event are fictional, with no real-world stakes attached.
Repeated tests do not automatically multiply confidence in a simple way. If two detectors share the same data or failure mechanism, their errors may be dependent. A second alert may supply less new information than it appears to. The original calculation assumes specified rates in a specified population; changing the workflow requires examining the new assumptions.
Real rates are estimates too
Here the rates are supplied as exact inputs so the denominator problem is easy to see. In practice, sensitivity and specificity are estimated from samples and may change across settings. The prevalence among people or items actually screened may differ from the prevalence in a reference dataset. Uncertainty in all three ingredients affects the answer.
It would therefore be misleading to take the 50% result and apply it to a medical test, fraud system or personal warning. The transferable skill is more modest: ask which population produced each percentage, and reconstruct the expected counts. A small false-positive rate can create a large pile when it is applied to a large enough background.
Further reading
OpenStax: contingency tables ↗OpenStax: independent and mutually exclusive events ↗Original documentation and useful background.