
The nearest point is easy to calculate. Choosing the space is the interesting part.
Imagine a tiny catalogue with just two measurements for each item. A query describes what you are looking for, and the simplest recommendation returns whichever item sits closest to that query. No conversation, personality test or large model is required. Yet this modest system already contains a consequential design decision: the numbers do not arrive with an agreement about how much each measurement should matter. The recommendation can change even when the items themselves stay exactly the same.
A distance formula can be precise while its meaning is still negotiable.
Put the items somewhere you can measure
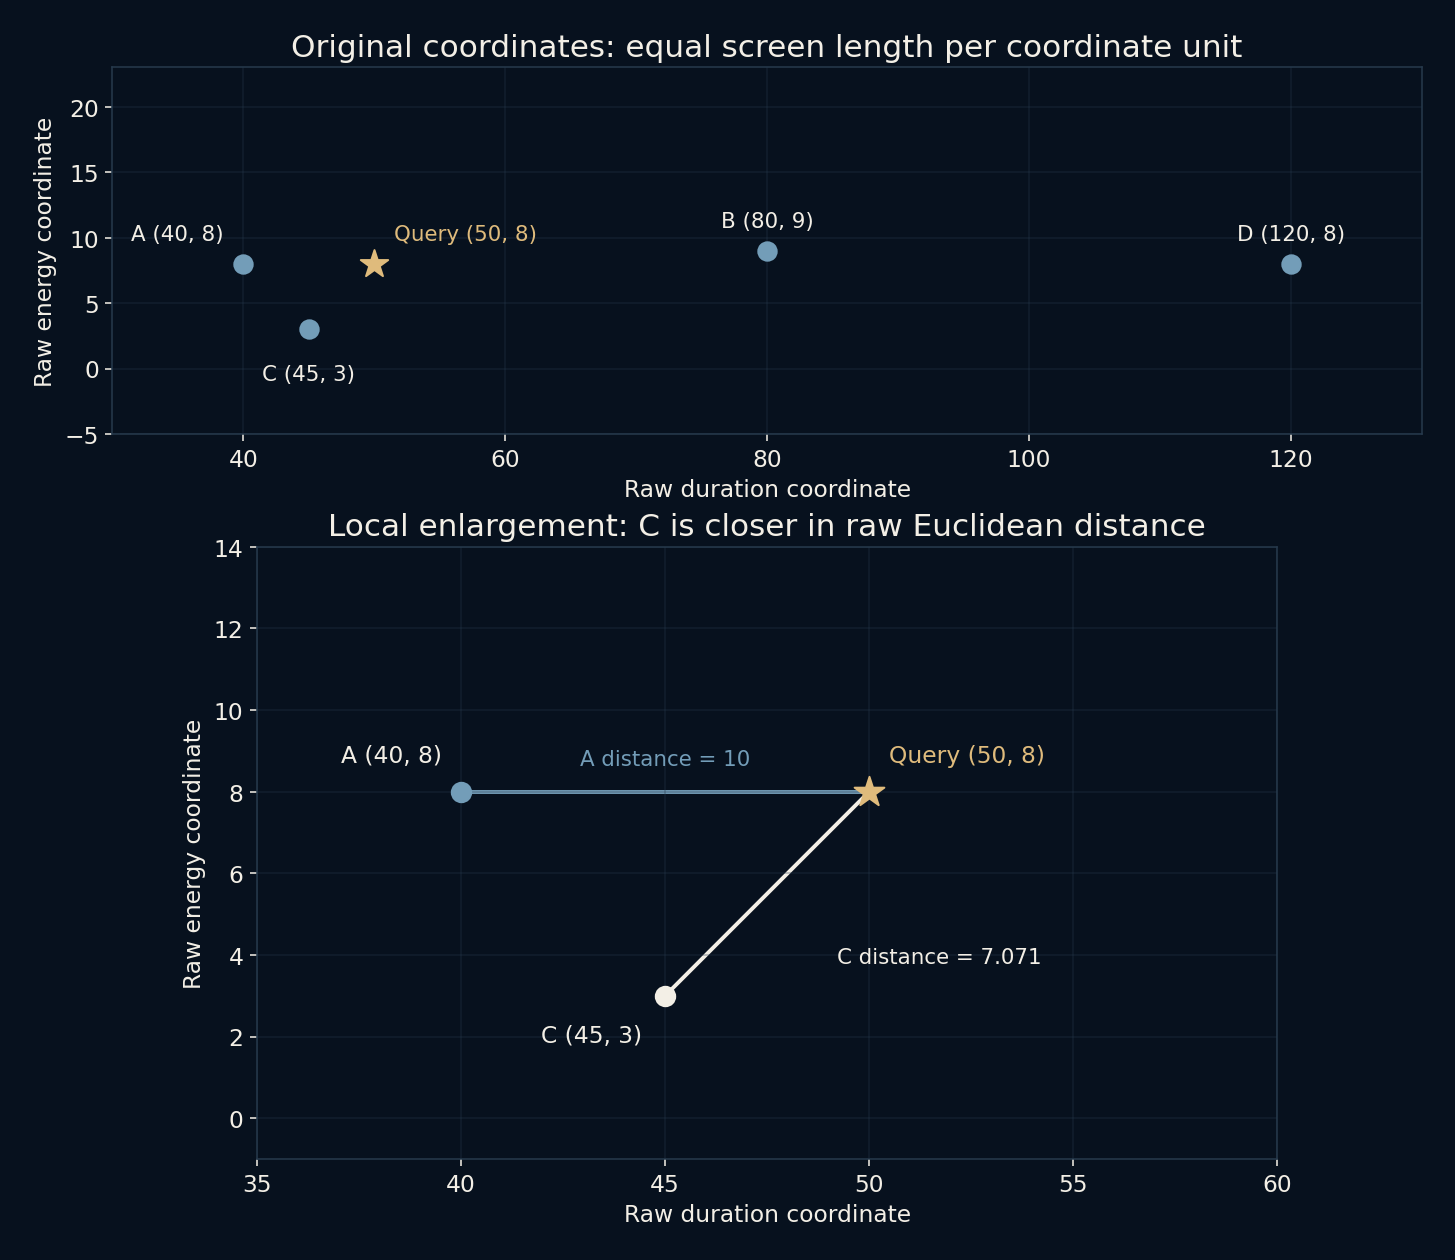
The query in this example is the point (50, 8). The four items, A to D, are (40, 8), (80, 9), (45, 3) and (120, 8). Think of the coordinates as two fictional properties. We deliberately avoid calling one a person's taste or assigning them real product prices. The example needs numbers with different numerical ranges, not a story about customers that was never observed.
For ordinary Euclidean distance, subtract each coordinate, square the differences, add them and take the square root. C wins at about 7.07, while A is 10 away. A matches the second coordinate exactly, but its difference of ten on the first coordinate outweighs C's combination of differences of five and five.
Units quietly become priorities
There is nothing mathematically wrong with that answer. The question is whether the two axes deserve equal treatment in their raw units. If one feature naturally ranges over hundreds and the other over ten, an equal numerical difference can represent very different changes. A measurement in millimetres also has a numerical range a thousand times larger than the same measurement in metres. The object did not change, but an unadjusted distance would.
This is why feature scaling belongs to the model rather than to cosmetic tidying. A system that combines incomparable units without thinking about them has still made a choice. It has allowed the numerical representation to set the priorities, usually without explaining that choice to the person reading the results.
A useful check is to convert a unit without changing its intended importance. Multiply the first coordinate of every item and the query by 1,000, and multiply its scale divisor by 1,000 too. The expanded script finds exactly the same distances within floating-point tolerance. Converting only the coordinates would instead change the model. This distinguishes an innocent change of notation from a genuine decision to care more about that feature.
Rescale the axes and a different neighbour wins
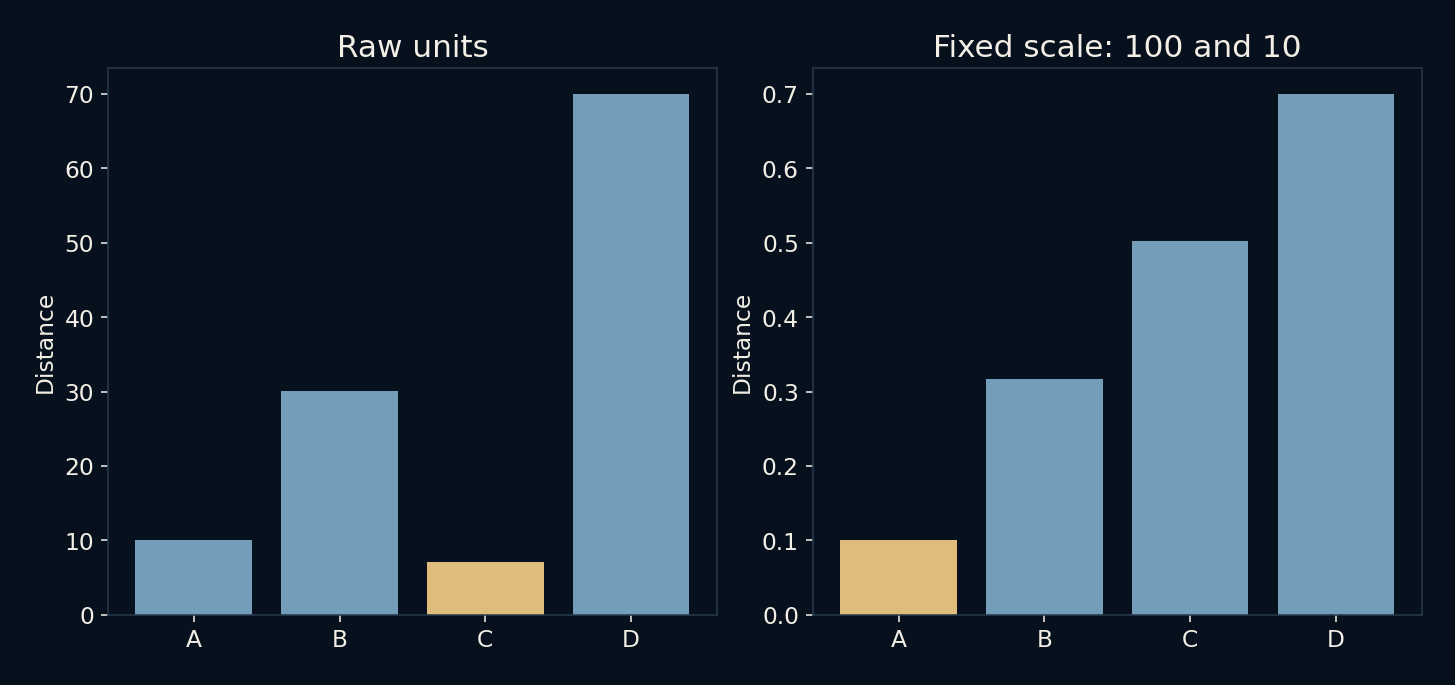
Now divide the first coordinate differences by 100 and the second by 10 before measuring distance. A becomes 0.10 away. C becomes about 0.5025 away, so A is now the closest item. B and D are about 0.3162 and 0.70 away respectively. Nothing about the catalogue or query changed; only the meaning assigned to distance changed.
Those divisors are explicit illustrative choices. They are not estimates learned from users, and they do not prove the new answer is better. In an actual application, scales might come from meaningful physical units, a training dataset's variability or a validated preference model. Each route carries assumptions. If the data distribution changes, a scale fitted earlier may deserve another look.
Neighbours can provide evidence, not just a winner
Returning several nearby items can be more informative than announcing a single match. Their distances show whether the winner is isolated, nearly tied or far from everything available. A top result is guaranteed even in a terrible catalogue if the system always chooses the minimum. The label nearest therefore says nothing by itself about whether the result is actually close enough to be useful.
A practical system also needs a policy for missing measurements and ties. Treating a missing feature as zero invents a measurement. Dropping it changes the space used for comparison. Neither behaviour should happen invisibly. The toy catalogue contains complete data and no winning tie, which keeps the geometric effect clear but leaves those production questions unresolved.
To make “close enough” concrete, move the query to (500, 8) and keep divisors [100, 10]. A distant query still produces a winner, this time D, but its distance is 3.8 rather than the original winner’s 0.1. An illustrative acceptance threshold of 0.2 accepts the original query and declines this distant one. The threshold is not learned or recommended for a real catalogue. It demonstrates that selecting a winner and accepting a match are two separate decisions, and that a system can return no suitable result.
A tidy feature space can leave out the important thing
Two items can be close on the recorded axes and very different in a property the system never measured. A recommendation built around size and weight cannot magically know that a particular material matters most. Adding more features does not automatically solve this. Unhelpful features can dilute useful ones, and in high dimensions intuitive ideas about neighbourhoods become less reliable.
The model is best understood as a claim about which differences matter. It can be tested against a clearly defined task, but not by looking at a neat scatterplot alone. Good recommendation evaluation would need relevant examples and outcomes. This article has neither real preferences nor a held-out user study, so it makes no claim about satisfaction, accuracy or conversion.
Find the boundary instead of picking two settings
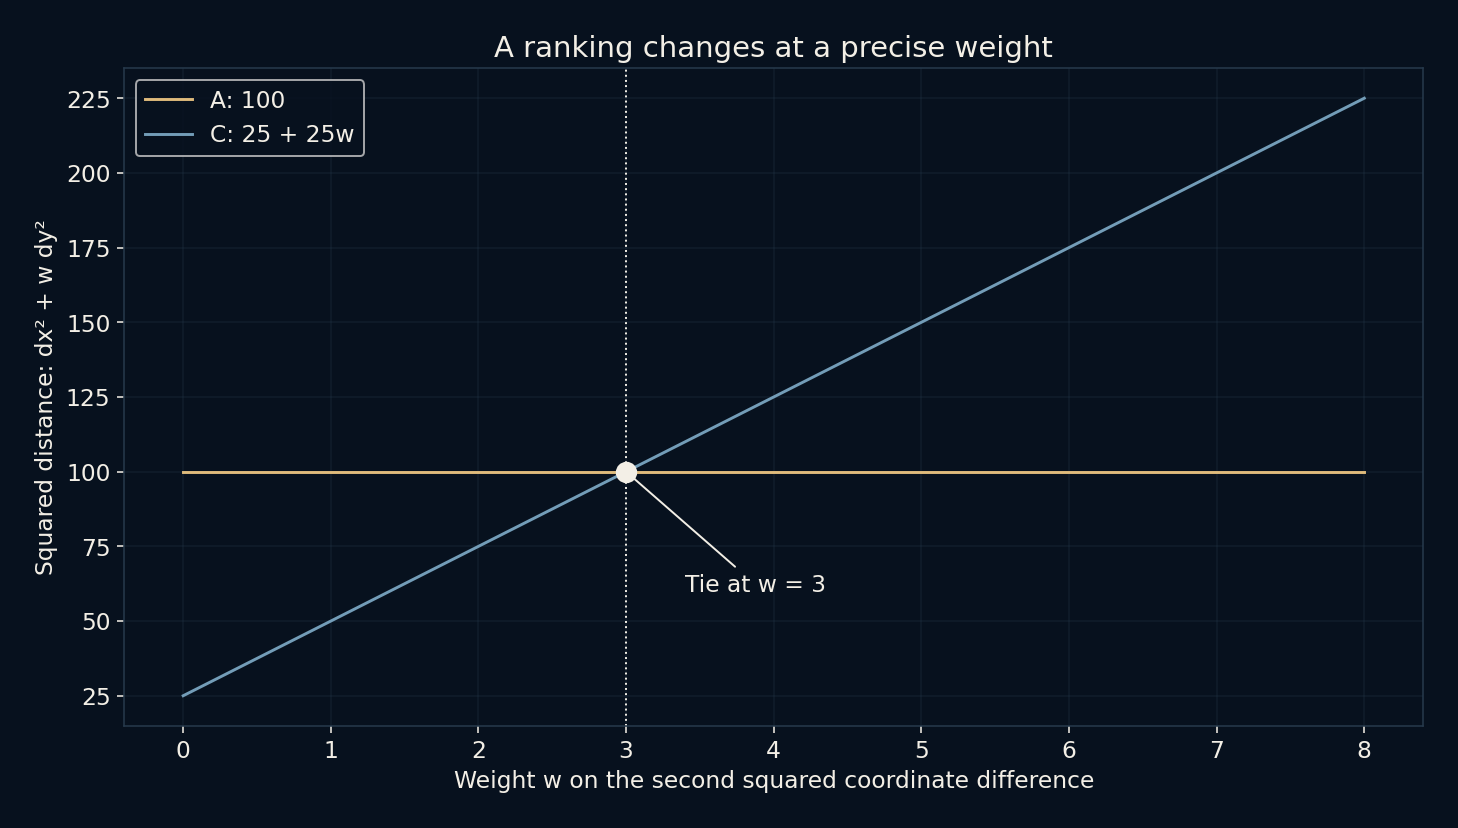
We can expose the choice with one adjustable number. Keep the first squared coordinate difference unchanged and multiply the second by a weight w. A then has squared distance 100, while C has 25 + 25w. They tie exactly when w is 3. At weight 2, C scores 75 against A’s 100; at weight 4, C scores 125 and A wins. B and D cannot beat A in this particular comparison, so the boundary genuinely changes the catalogue winner.
Raw Euclidean distance corresponds to w = 1. The earlier divisors [100, 10] correspond to w = 100 after removing a common factor of 1/10,000 from all squared distances. That common factor changes the reported size but not the ranking. The new plot shows the transition near three rather than treating two arbitrary settings as the whole story. If a small, defensible weight change reverses a recommendation, showing several candidates may be more useful than presenting the first as an obvious answer.
Look at a recommendation before it looks impressive
A small, visible example is a good place to ask awkward questions. Which features are present? What units do they use? How are they scaled? Would a harmless unit conversion alter the answer? Can the system admit that every candidate is a poor match? These questions are less glamorous than discussing the latest model, but they often reveal more about what a system is actually doing.
Here the local checks verify both winners and confirm that the query is zero distance from itself. The comparison is deliberately narrow. It demonstrates how scaling changes a ranking, rather than settling which scaling rule a real service should use. The most useful result is not that A wins. It is that we can explain exactly why C stopped winning.
Further reading
scikit-learn: nearest-neighbour methods ↗scikit-learn: preprocessing and feature scaling ↗Original documentation and useful background.