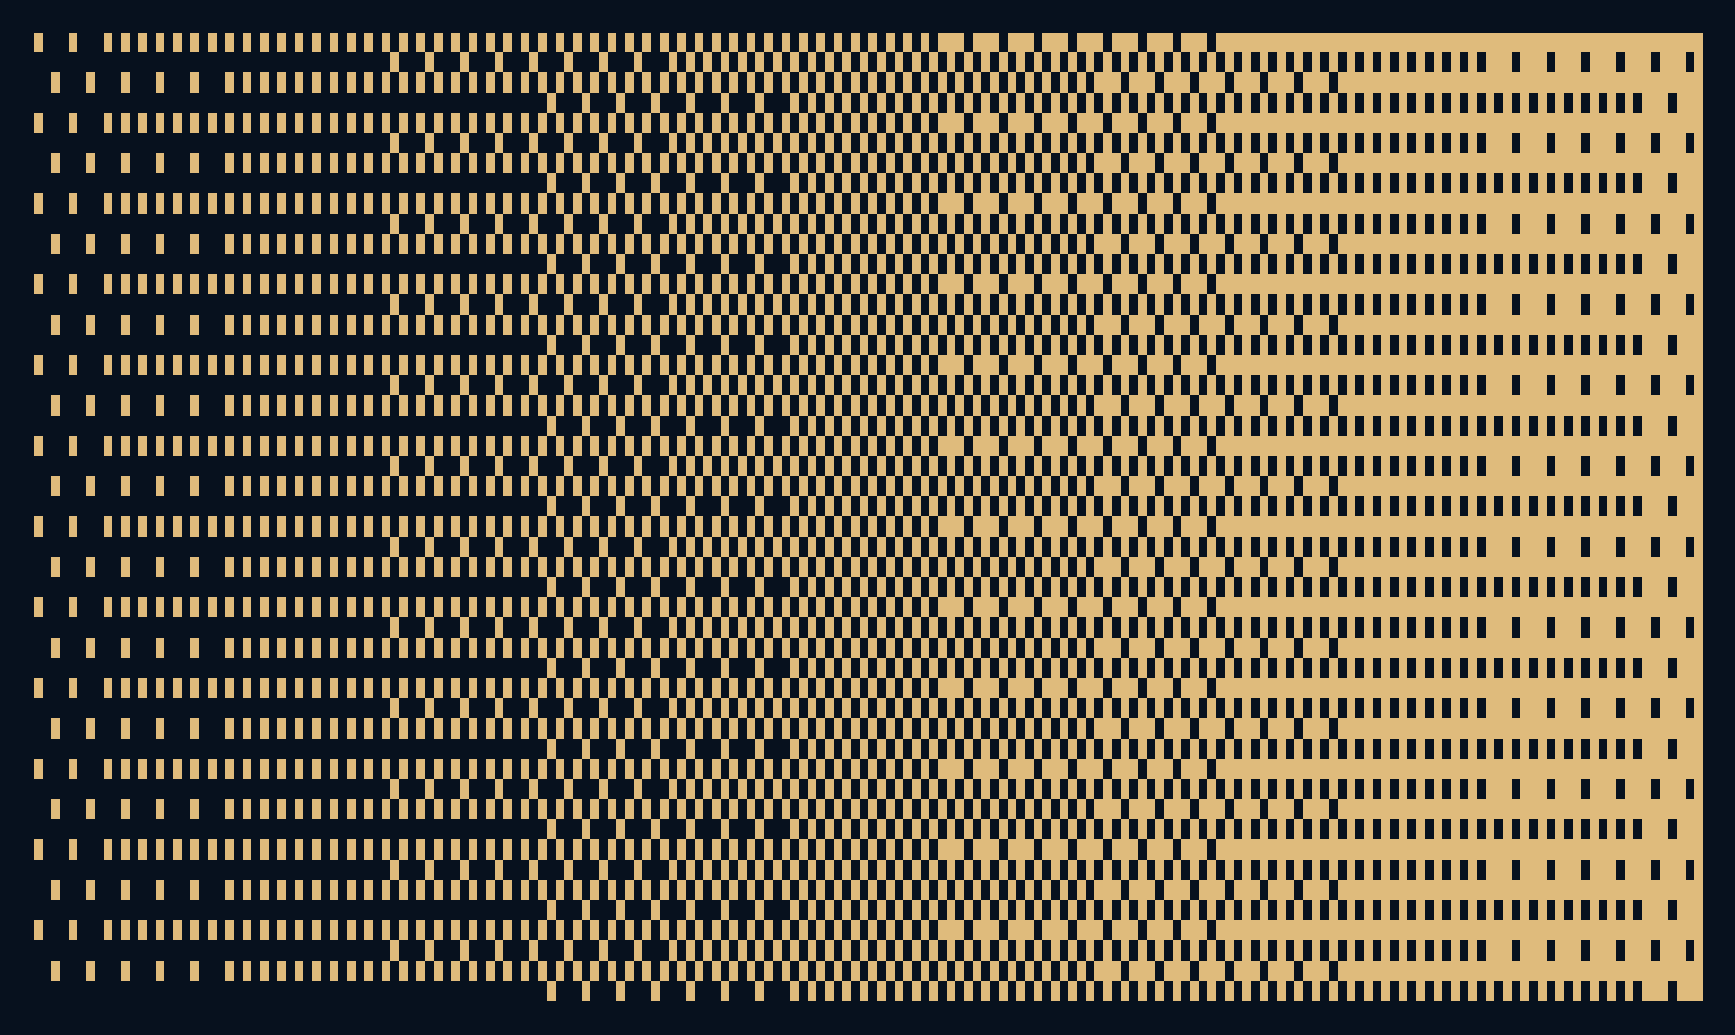
A grey pixel is forbidden. A patch that looks grey is still possible.
A smooth gradient asks for many intermediate values. A strictly black-and-white output can offer only two. Rounding every pixel independently produces a blunt result: one side becomes black and the other white. Dithering makes a different bargain. It gives up some smoothness at the pixel level so that groups of pixels can preserve more of the original tone. The dots are not an accidental texture laid over a picture. Their placement is doing part of the picture's work.
A limitation at one pixel can become a pattern across many pixels.
A threshold throws away the middle
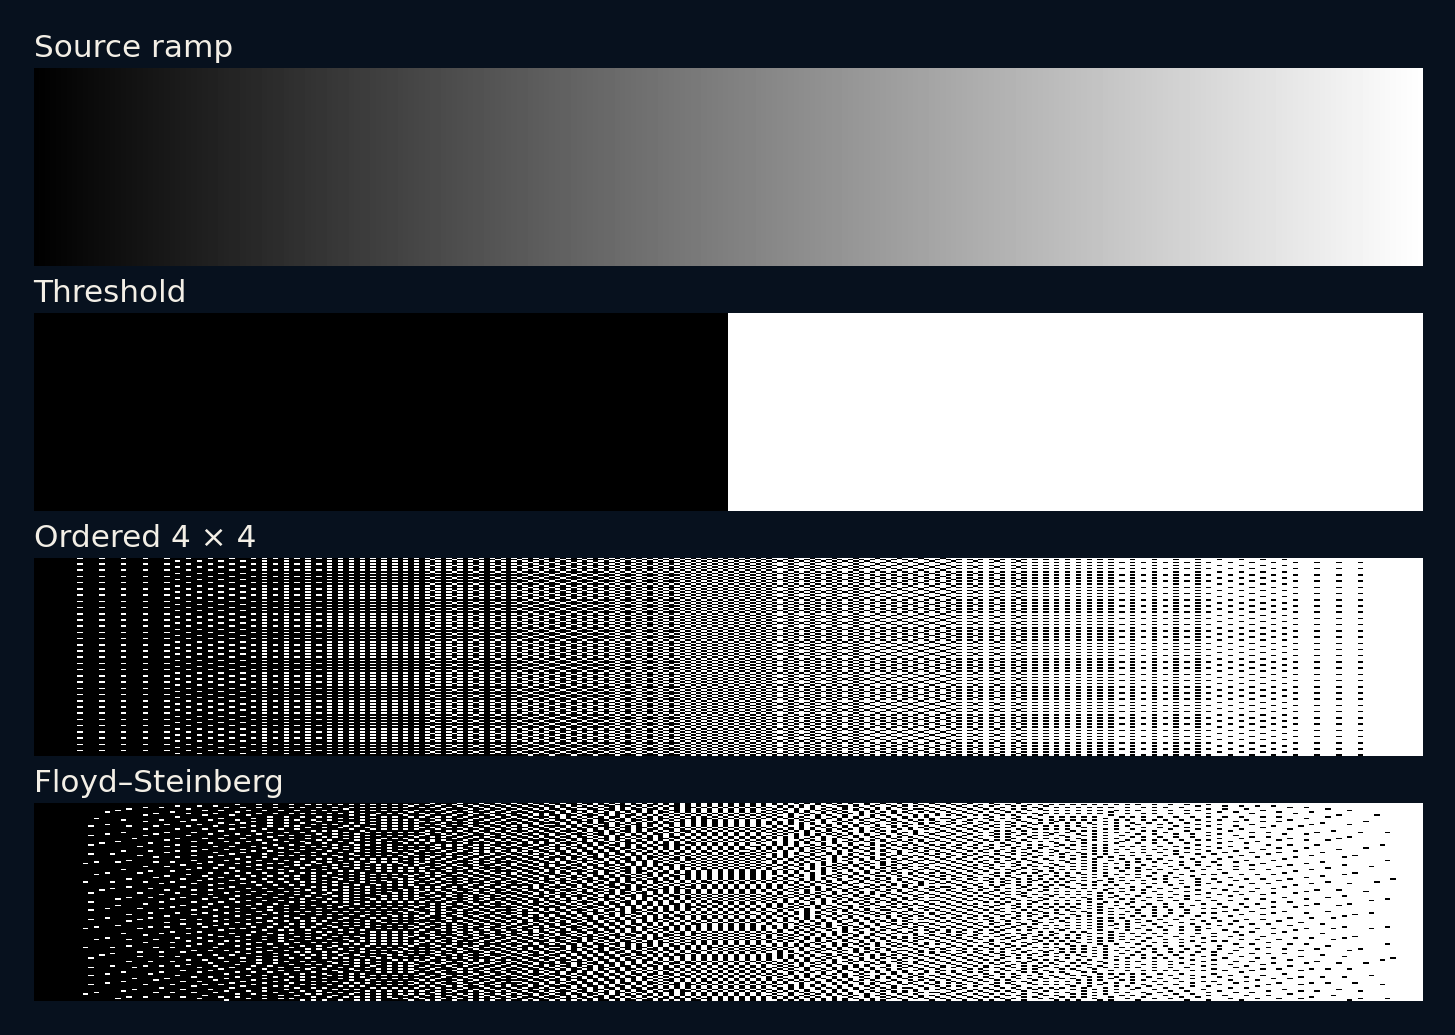
Our source is a synthetic ramp, 256 pixels wide and 128 high, running from zero to one. Every row contains the same gradual change. The simplest conversion uses a threshold of one half: lower values become zero, and higher values become one. The output has the right extremes, but most of the progression between them disappears into a single boundary.
This operation is useful when a hard decision is actually wanted. It is a poor way to preserve a smooth tone. The problem is not that the computer failed to find a clever enough shade of grey. Intermediate output values are explicitly unavailable. Any improvement must use the spatial arrangement of the two values that remain.
Give neighbouring pixels different thresholds
Ordered dithering replaces the single threshold with a small matrix of thresholds. We repeat a four-by-four Bayer matrix across the ramp. As the source value rises, more positions within each repeated tile become white. The output still contains only zero and one, but nearby pixels collectively represent intermediate levels through their proportions.
This approach is predictable and easy to reproduce. It also leaves a recognisable periodic texture. That texture can be attractive in a deliberately limited visual style, or distracting when it fights the image's own fine patterns. The matrix does not discover objects or understand edges. It applies the same repeating rule wherever it lands.
The four-by-four tile also gives an example you can count without software. Its sixteen thresholds lie halfway between multiples of one sixteenth. A constant source of 0.25 turns four cells white; 0.5 turns eight white; 0.75 turns twelve white. Those exact proportions hold for complete aligned tiles. A crop through a tile edge, a different block alignment or a source that changes within the tile can give a different local average. Counting a neat full tile explains the mechanism without promising exact tone preservation at every location.
A rounding mistake can become a neighbour's information
Error diffusion takes another route. After choosing zero or one for a pixel, it calculates the difference between the working value and that output. A Floyd–Steinberg rule distributes this error to neighbours that have not been processed yet: seven sixteenths to the right, with the remaining shares going to three pixels in the next row. Later decisions can compensate for earlier rounding.
Our implementation scans each row from left to right and discards error that would leave the image. It does not alternate direction on successive rows. Those choices matter because a sequential process can create directional texture. Error diffusion avoids the same small repeated tile, but it is not free from visible patterns or boundary effects.
Judge the average in a neighbourhood
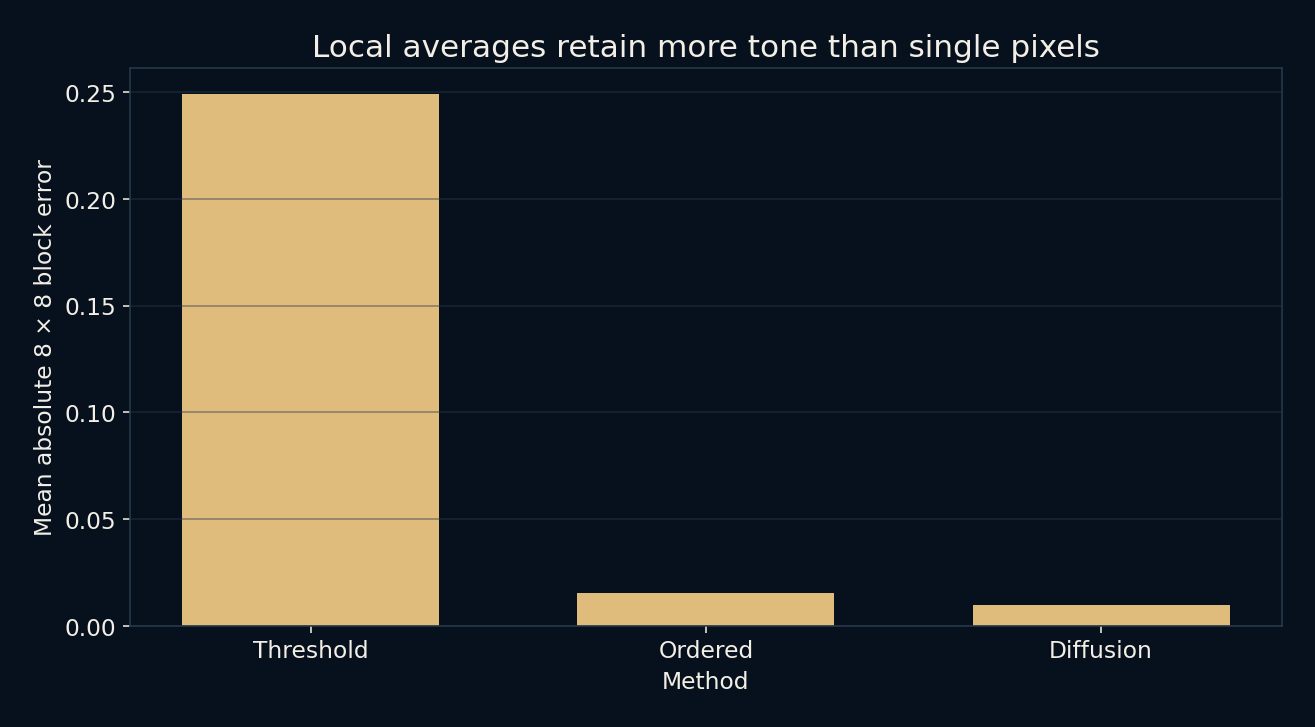
Comparing each output pixel directly with the source would punish the very dots that make the technique work. Instead, this experiment divides the images into eight-by-eight blocks and compares each block's mean value with the corresponding source mean. It then averages the absolute differences across all blocks. This measures one particular kind of local tonal preservation.
The measured errors are about 0.2490 for a hard threshold, 0.01556 for ordered dithering, and 0.00986 for error diffusion. Both dithers preserve these block averages much better on this ramp. The result does not say error diffusion looks better on every photograph or at every viewing distance. A local numerical average is not a complete model of vision.
The same dots can look smooth or restless
Seen close up, the result is a collection of hard decisions. Seen farther away, fine patterns can merge into an impression of intermediate tone. The display, print process, viewing distance and surrounding image all affect that impression. Resizing a dithered image can also introduce new artefacts, because resampling interacts with a pattern that was designed at a particular pixel spacing.
The experiment uses scalar numbers, not a calibrated brightness model. A numerical value of one half should not automatically be called half the perceived brightness of a screen. Gamma encoding, display response and printing behaviour would need separate treatment. The cover recolours the pattern for the site's palette; the actual comparison figures retain the black-and-white outputs.
A score can reward the wrong picture for your purpose
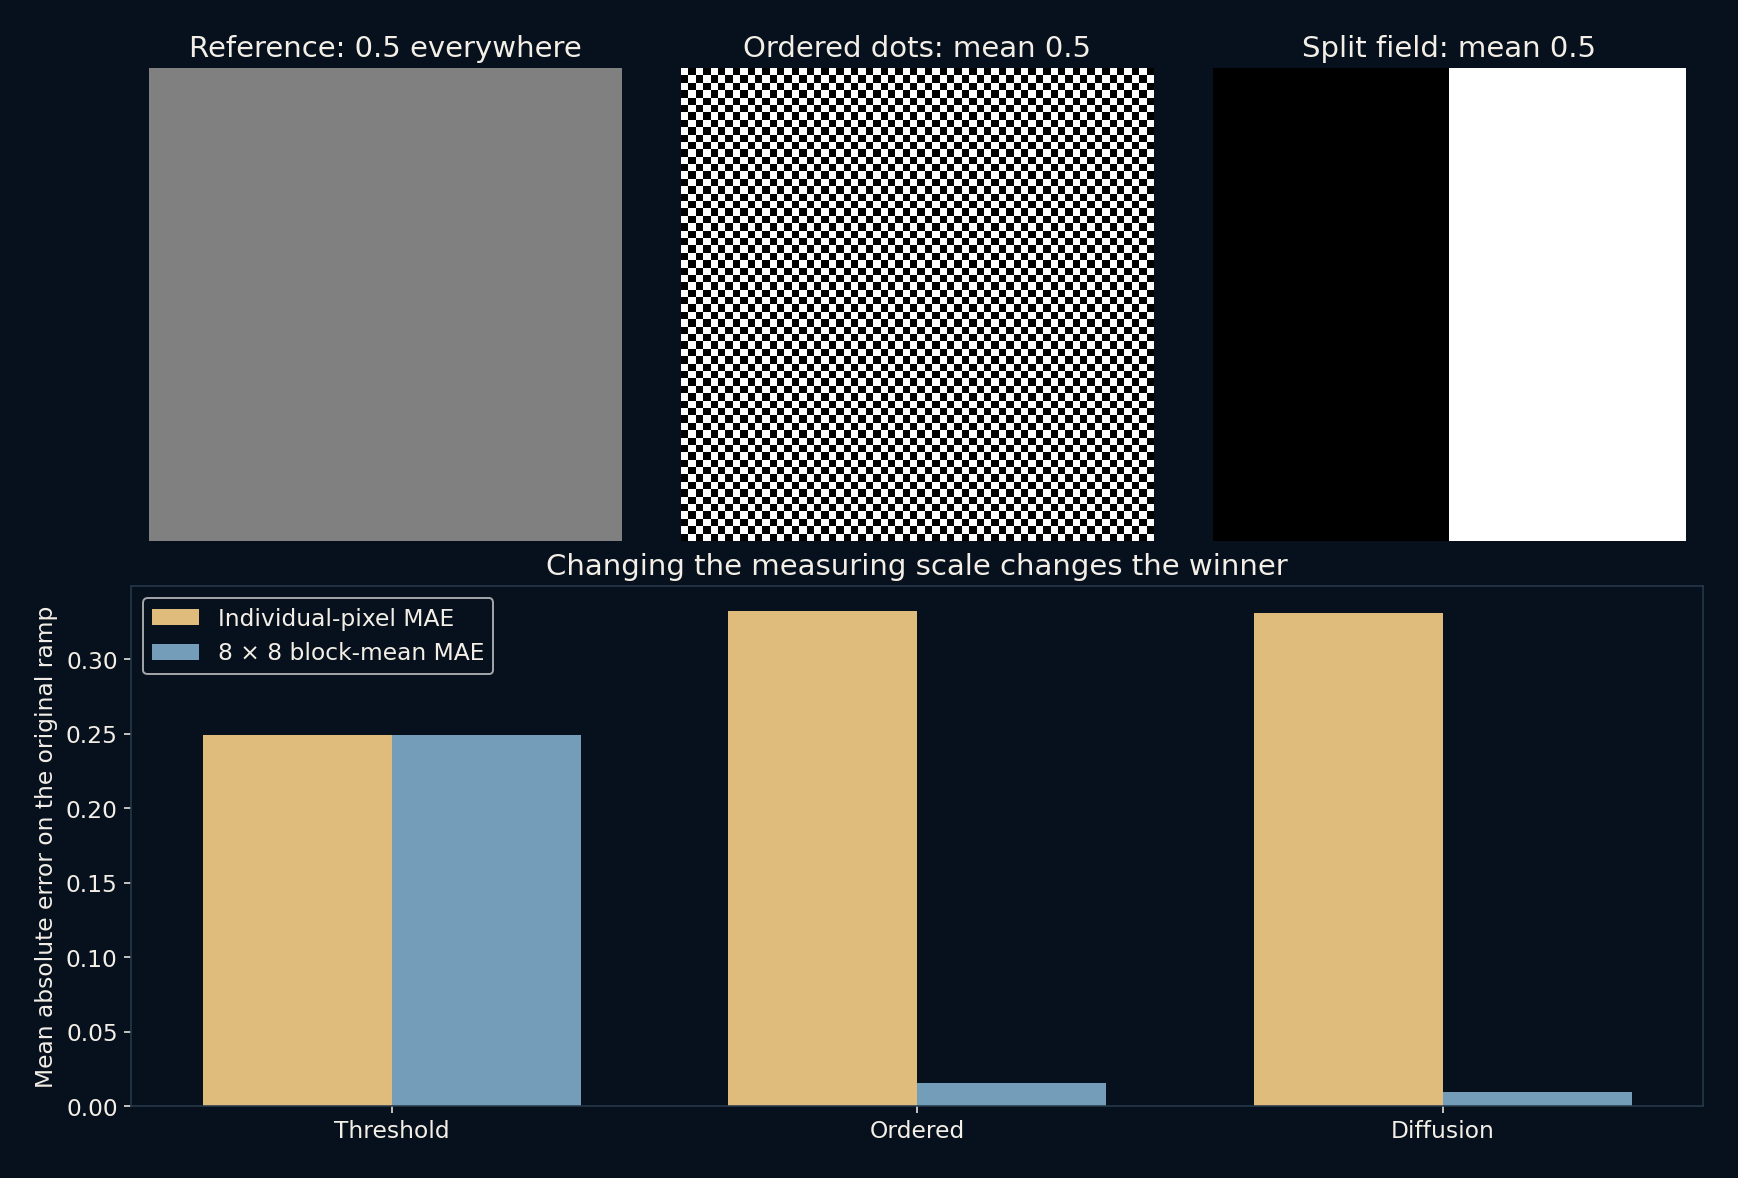
Change only the measuring scale and the ranking reverses. On the original ramp, individual-pixel mean absolute error is 0.24902 for thresholding, 0.33235 for ordered dithering and 0.33120 for diffusion. Thresholding wins that contest because each pixel independently chooses the nearer available endpoint. Yet the same output loses badly when the score compares eight-by-eight neighbourhood means. The arithmetic is not inconsistent: the two scores reward different properties, one local to a single decision and the other to a patch.
Even a perfect global mean can hide a poor tonal image. The extension compares a constant 64 × 64 field of 0.5 with its ordered dither and a deliberately crude image whose left half is black and right half white. All three means are exactly 0.5. Against the uniform reference, eight-by-eight block error is zero for the aligned ordered pattern but 0.5 for the split field. Preserving the total amount of white does not preserve where the tone belongs. The new figure makes this failure visible rather than asking the reader to trust a summary number.
There is more than one way to spend a constraint
Ordered dithering offers a stable repeating structure. Error diffusion uses information from earlier decisions and often produces a less regular texture. A hard threshold preserves sharp binary boundaries. Each method can be appropriate for a different purpose, and the attractive answer may differ from the one that wins a particular numerical score.
The local checks confirm identical image dimensions, strictly binary output and lower block-average error for both dithers on this source ramp. They do not establish a universal ranking. What the experiment makes visible is a useful design idea: when individual elements are limited, their relationships can carry information that no element can represent on its own.
Further reading
ImageMagick: colour quantization and dithering ↗Pillow: image conversion and Floyd–Steinberg dithering ↗Original documentation and useful background.