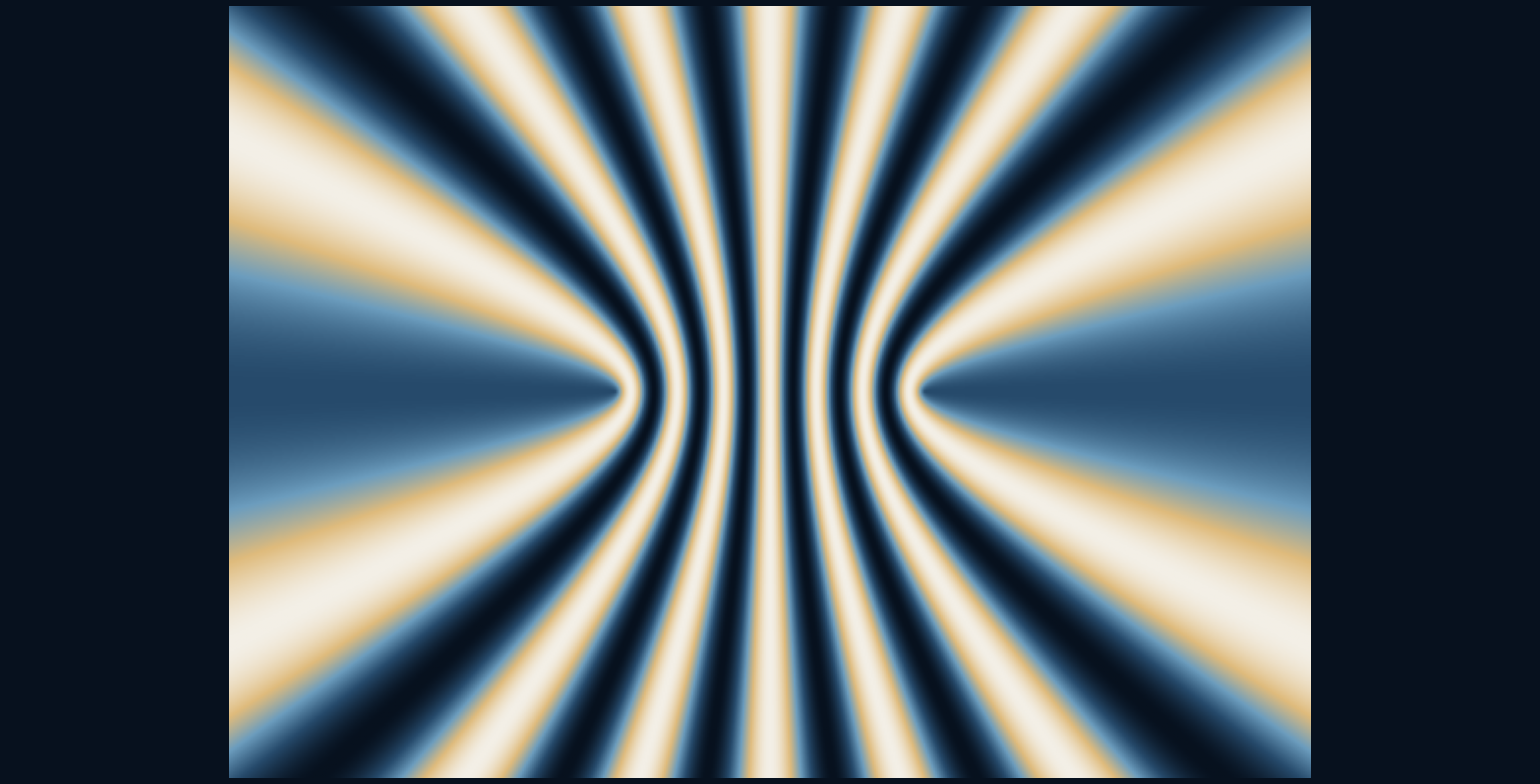
Why do overlapping ripples leave alternating quiet and active regions?
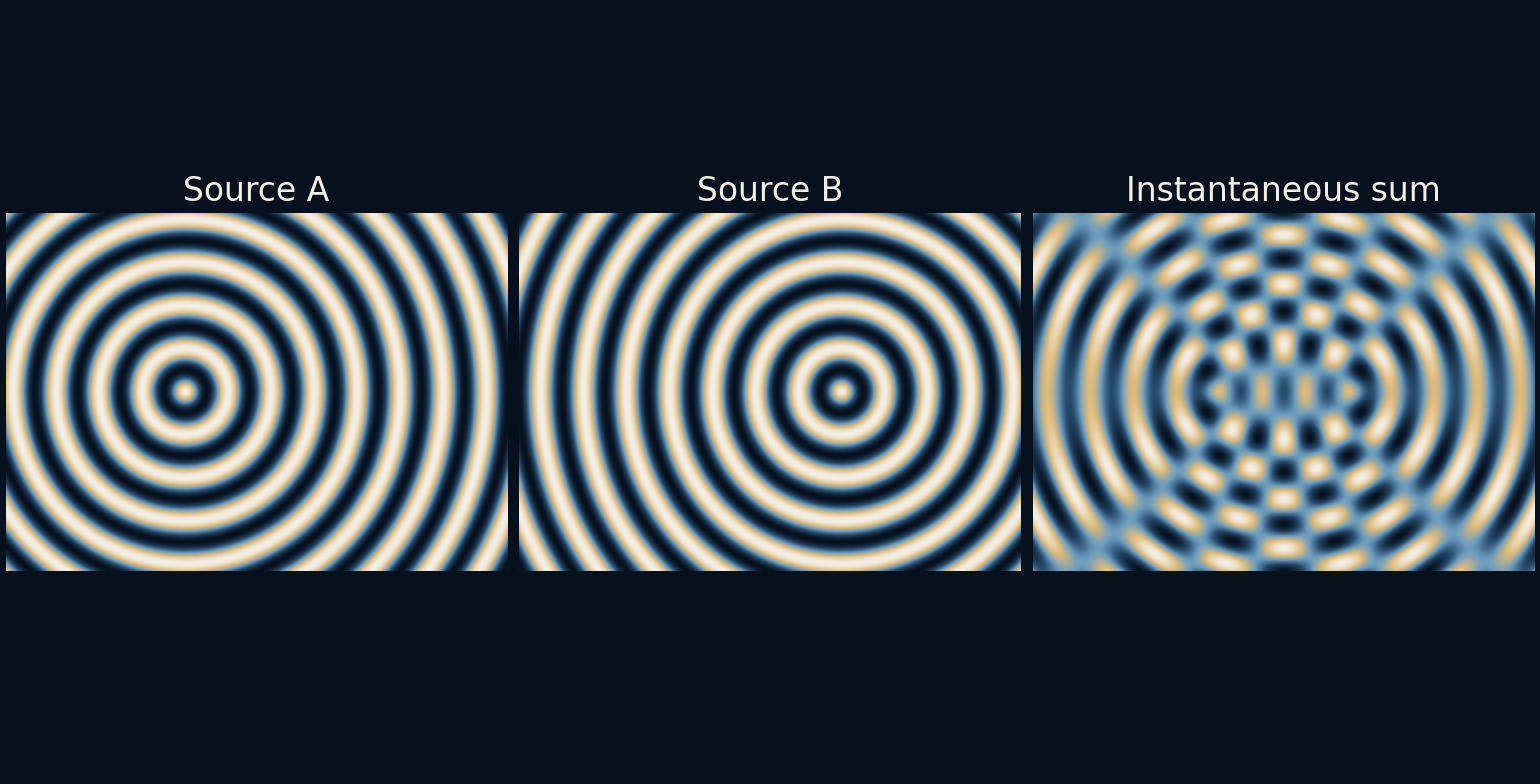
Each source in the illustration sends out a pattern of circular wavefronts. Add the two disturbances at every position and a new structure appears: regions where the waves tend to reinforce, separated by regions where they tend to oppose. The pattern comes from differences in travel distance, not from drawing stripes into either source.
The path difference writes the pattern.
Distance becomes phase
The two sources sit four model-length units apart and oscillate together. Their common wavelength is 1.2 units. At a point in the plane, each source contributes a cosine whose phase depends on the distance from that source. A longer path means a different position within the repeating wave cycle.
To isolate this relationship, every contribution has amplitude one regardless of distance. Real spreading waves generally change amplitude as they travel, and actual water waves have additional physics. Our field is therefore a two-source phase illustration, not a physically complete simulation of a pond, an acoustic room or the electromagnetic field near an antenna.
Equal journeys reinforce
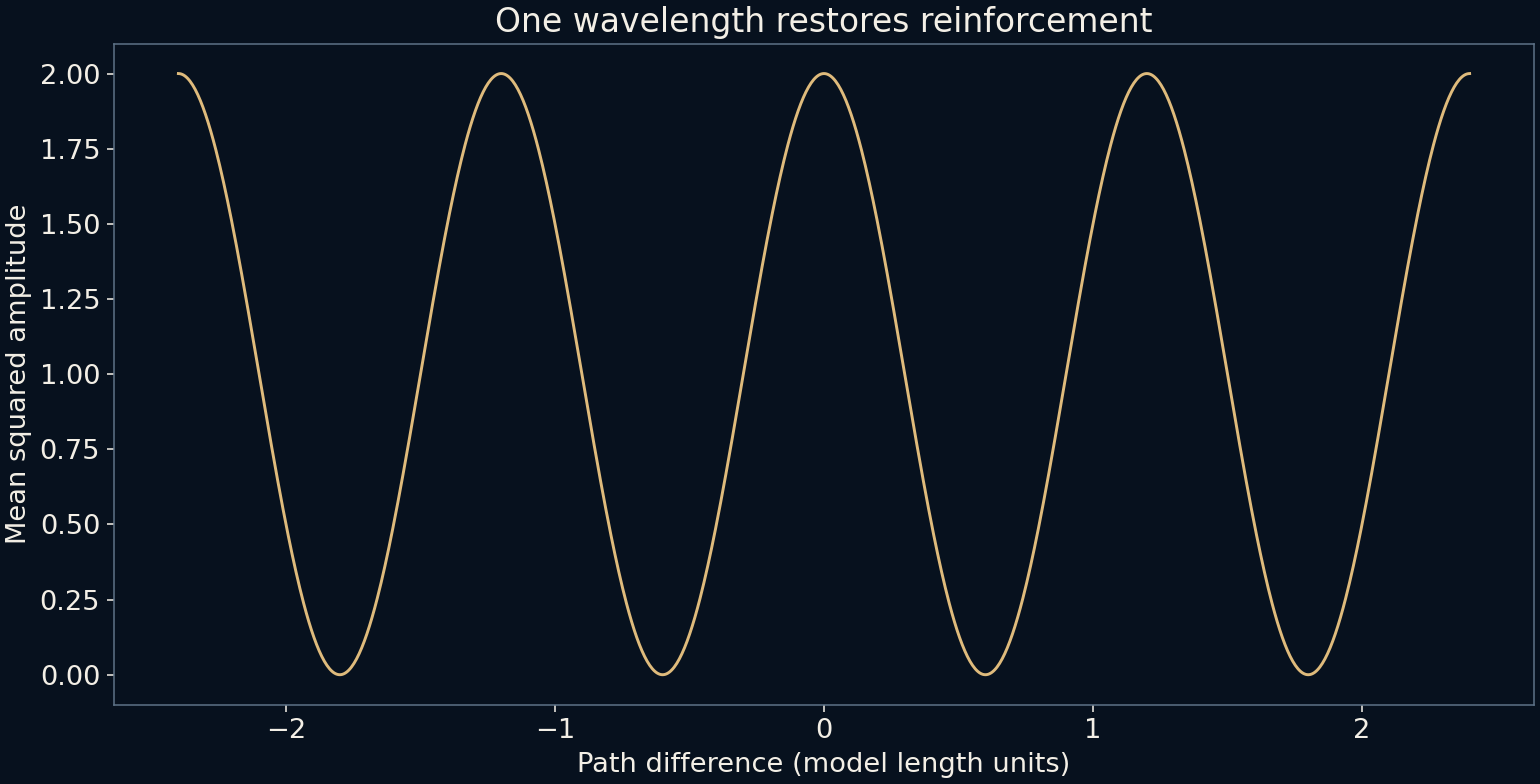
On the perpendicular bisector between the sources, the two distances are equal. The waves arrive with the same phase in this ideal setup and reinforce. Two unit-amplitude contributions can make a combined amplitude of two. A difference of one full wavelength also brings the phases back into alignment.
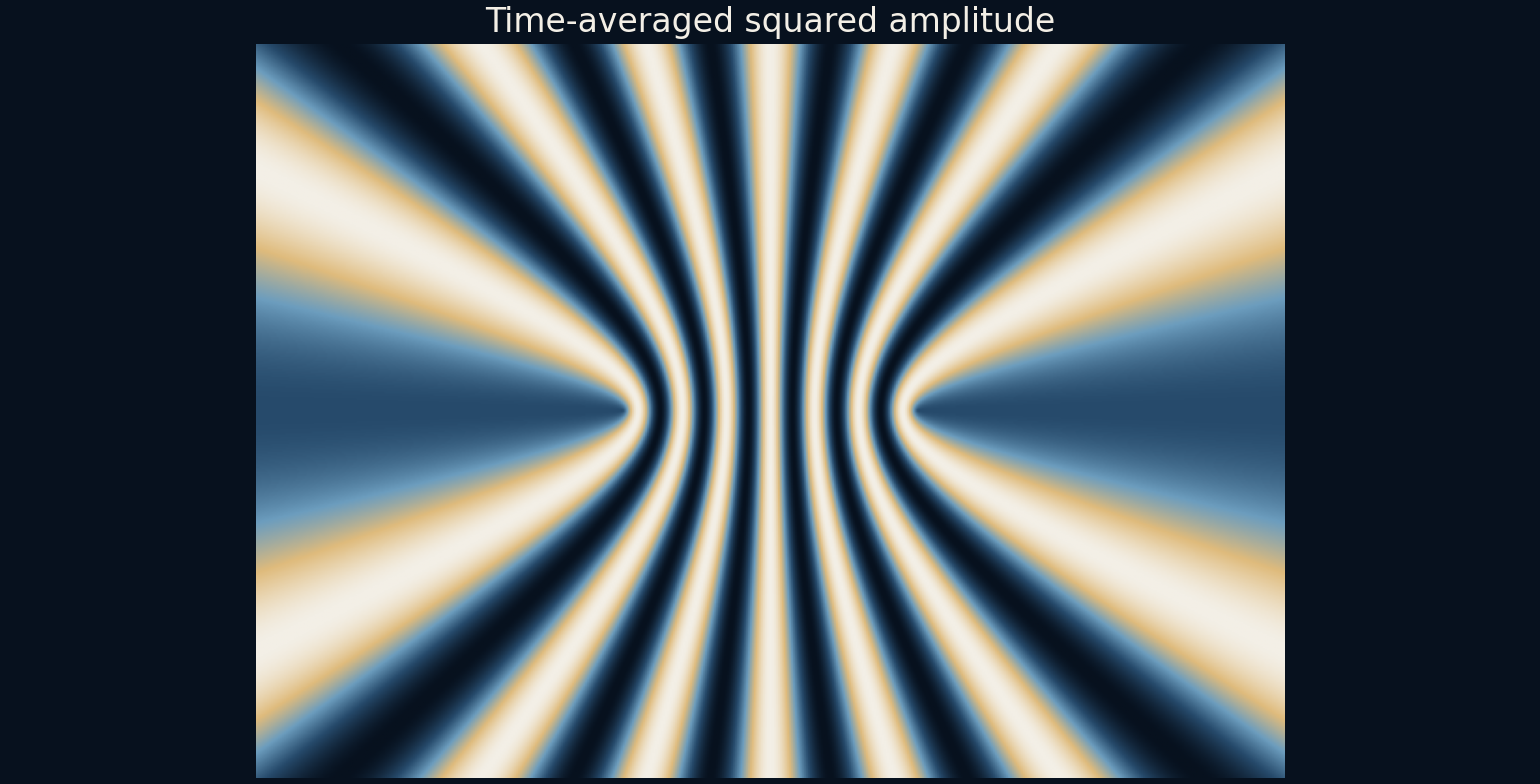
If the path difference is half a wavelength, one wave arrives half a cycle away from the other and the equal amplitudes cancel. Further odd half-wavelength differences do the same. These repeating conditions divide the plane into bands. Curves of constant difference in distance to two fixed points are hyperbolas, which explains the geometry of the fringe pattern.
The central line offers a quick numerical check. Put the sources at x = −2 and x = +2. At the point (0, 3), both paths are the square root of 13, so the contributions reinforce. Between the sources on the horizontal axis, path difference has magnitude twice the distance from the centre. Moving to x = 0.3 therefore gives a 0.6-unit difference, half the wavelength, and cancellation; x = 0.6 restores reinforcement.
A snapshot and an average answer different questions
The three-panel picture shows each source and their instantaneous sum at one chosen phase. Bright and dark there indicate signed displacement in the visualization, not a direct measurement of brightness or sound power. Let time pass and those instantaneous values oscillate even at a location that remains within the same interference band.
The main interference map instead averages the square of the combined amplitude over a cycle. For our equal unit contributions, the result is one plus the cosine of the phase difference. It ranges from zero at cancellation to two at reinforcement. One source alone has mean square one half, so the reinforced value is four times that single-source reference.
A dark band is a local statement
The word cancellation can sound as though energy is being destroyed. In a complete physical wave system, interference and energy transport must be considered together. Locally small amplitude does not imply that the entire wave field has vanished. Reinforced and weakened regions occur as part of one spatial pattern.
Our equal-amplitude-without-decay construction does not compute energy flux or enforce a full boundary-value solution. We therefore label the map mean squared amplitude rather than calibrated intensity. Its purpose is to show the interference term and its dependence on path difference, without borrowing physical claims that would require a more complete model.
The geometry also limits which bands can exist. The difference between distances to two points cannot exceed their separation, here four units. Constructive path differences are integer multiples of 1.2, so only orders −3 through +3 fit this bound. An eighth or ninth constructive order cannot be created simply by extending the drawing farther outward. The zero-order case is the straight perpendicular bisector; the nonzero constant-difference curves form the hyperbolic branches.
The pattern depends on a stable relationship
The two sources are coherent in this calculation: they share a frequency and keep a fixed phase relationship. If their relative phase drifts during an observation, the bands move. Averaging over many unrelated phase differences can wash the contrast out, even though the individual waves remain present.
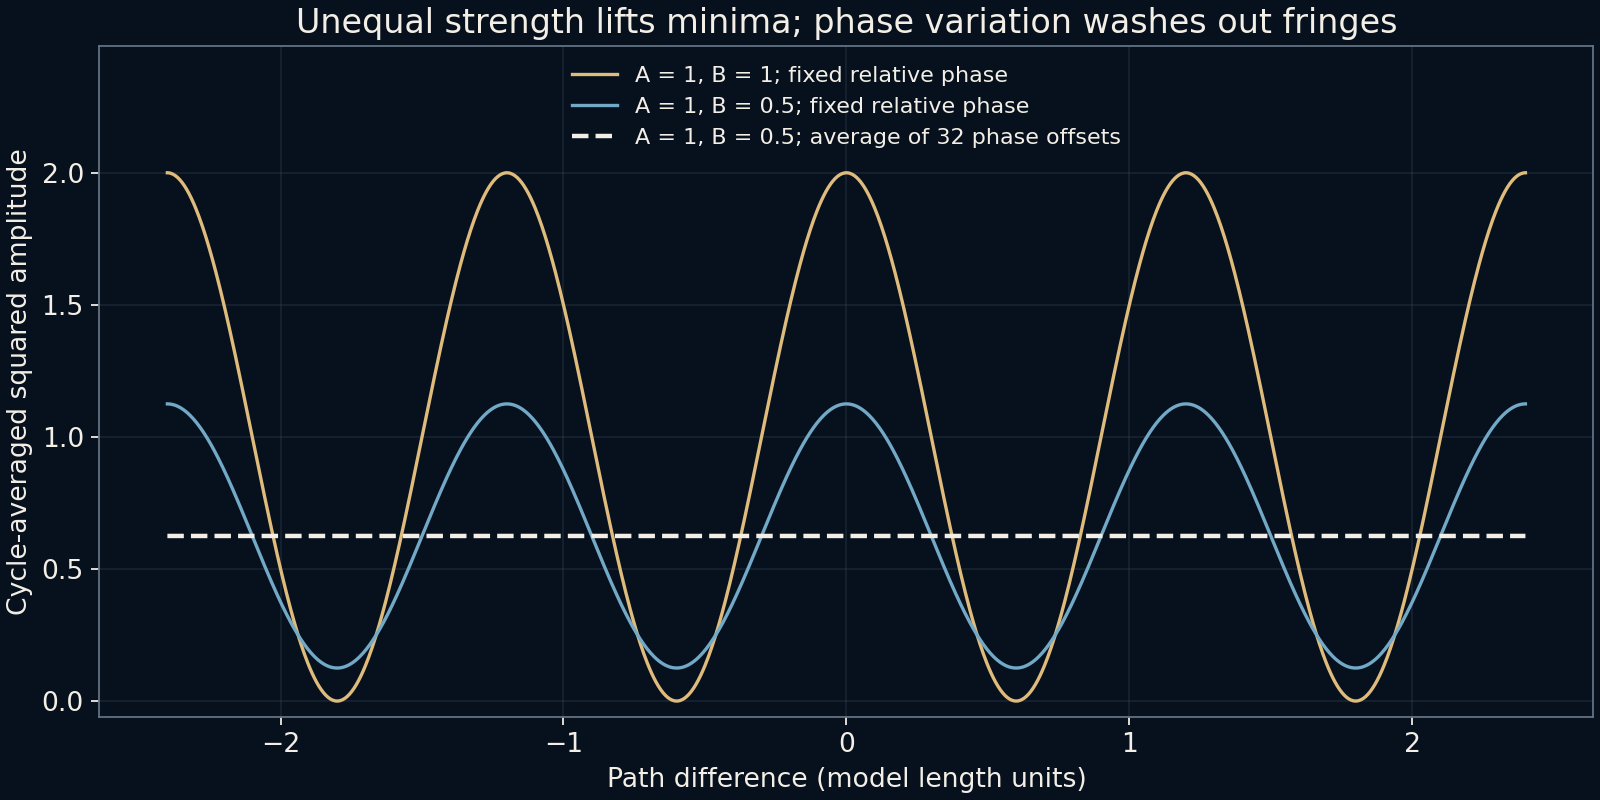
Unequal amplitudes also change the deepest minima. The weaker contribution cannot exactly cancel a stronger one, so the dark bands no longer reach zero. Multiple wavelengths create overlapping fringe systems with different spacings. These complications explain why an ideal monochromatic figure is much cleaner than many everyday combinations of ripples, sound or light.
Changing a fixed relative phase moves the conditions rather than necessarily erasing them. A quarter-cycle offset is equivalent to shifting the path-difference condition by a quarter wavelength, 0.3 model units here. By contrast, an observation that averages over many phase offsets can erase a stable-looking pattern. The observation time therefore belongs in the explanation: a snapshot, a cycle average at fixed relative phase and an average over changing relative phase are three different operations.
Read the difference rather than the distance alone
The path-difference graph repeats every 1.2 units, matching the wavelength. It gives a compact way to predict the local result without inspecting every wavefront. What matters for phase alignment is the difference between the two journeys, not simply whether a point is near or far from both sources.
That distinction connects the attractive pattern to a usable idea. Two locally simple oscillations can form a complicated spatial map because their relative timing changes from place to place. The new structure is real within the model, but its meaning remains tied to the assumptions that made the two sources comparable.
What happens when the sources stop matching?
Let one amplitude remain one and reduce the other to 0.5. For amplitudes a and b, the cycle-averaged square is (a² + b²)/2 + ab cos(phase difference). The unequal pair now ranges from 0.125 to 1.125 instead of zero to two. At opposition the remaining oscillation has amplitude 0.5, whose mean square is 0.125. A dark region can therefore be a genuine interference minimum without being perfectly dark.
One contrast measure divides the difference between maximum and minimum by their sum. It is one for the equal pair and 0.8 for the unequal pair. The added graph then averages the unequal pair over 32 evenly spaced relative phases. Its curve becomes a flat 0.625, the sum of the two separate mean squares. This is a deterministic calculation of phase averaging, not a measured coherence time or a claim about a particular light source.
When a fringe pattern becomes faint, these possibilities suggest different questions. Did one source become weaker, did relative phase wander during observation, or did the scene contain several wavelengths? A single blurred picture may not distinguish them. Compare the assumptions before treating low contrast as evidence that waves are absent. The algebra separates two easily confused effects: changing the depth of the minima and averaging away where the minima occur.
Further reading
OpenStax: Interference of waves ↗OpenStax: Young’s double slit experiment ↗Original documentation and useful background.