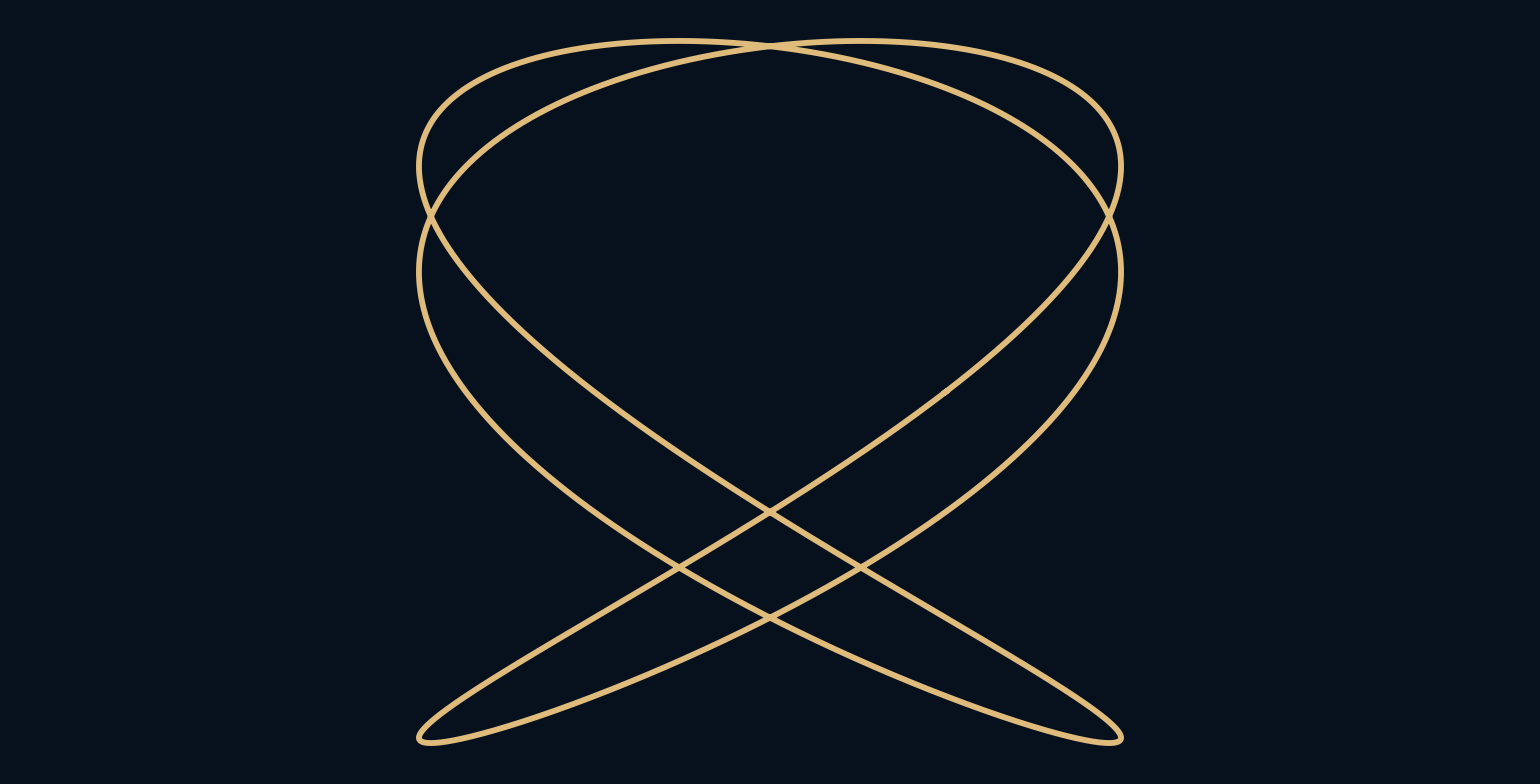
How can two smooth back-and-forth movements produce a woven-looking curve?
Imagine a pen whose horizontal position follows one sine wave while its vertical position follows another. Neither movement is complicated in isolation. Their timing, however, determines whether the pen draws a line, an ellipse or a network of looping crossings. Lissajous figures make the relationship between two rhythms visible as geometry.
The drawing remembers the relationship between the rhythms.
Give each axis its own clock
The basic construction sets horizontal position to a sine wave with frequency a and vertical position to another with frequency b. A phase offset can shift the horizontal wave relative to the vertical one. Amplitudes determine width and height, while frequencies determine how often each coordinate repeats during the chosen parameter interval.
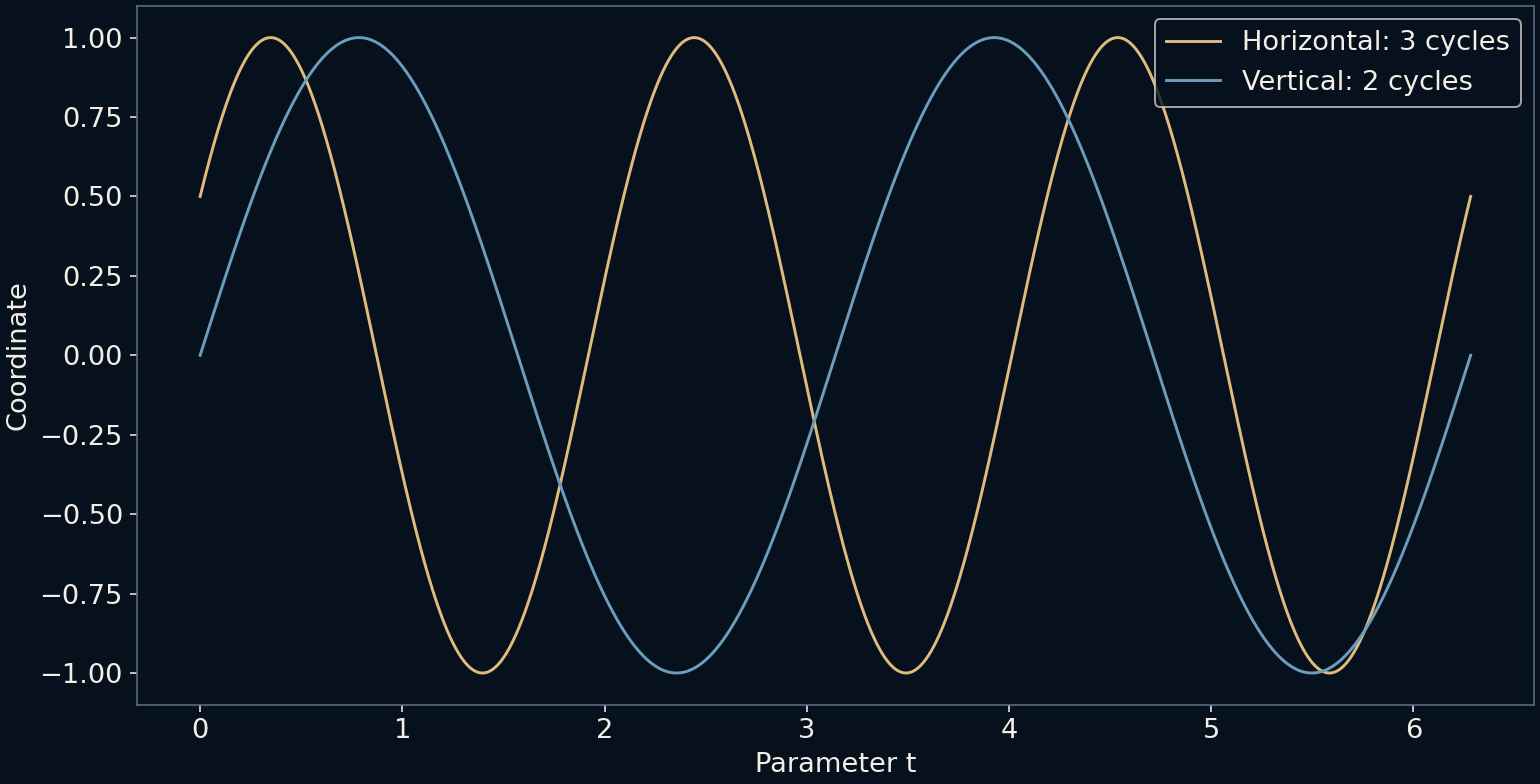
Our cover uses x equal to sine of three times t plus 30 degrees, and y equal to sine of two times t. As t runs from zero to two pi, the horizontal coordinate completes three cycles and the vertical coordinate completes two. Both remain between minus one and one, so the entire drawing stays inside a known square.
A shared return closes the curve
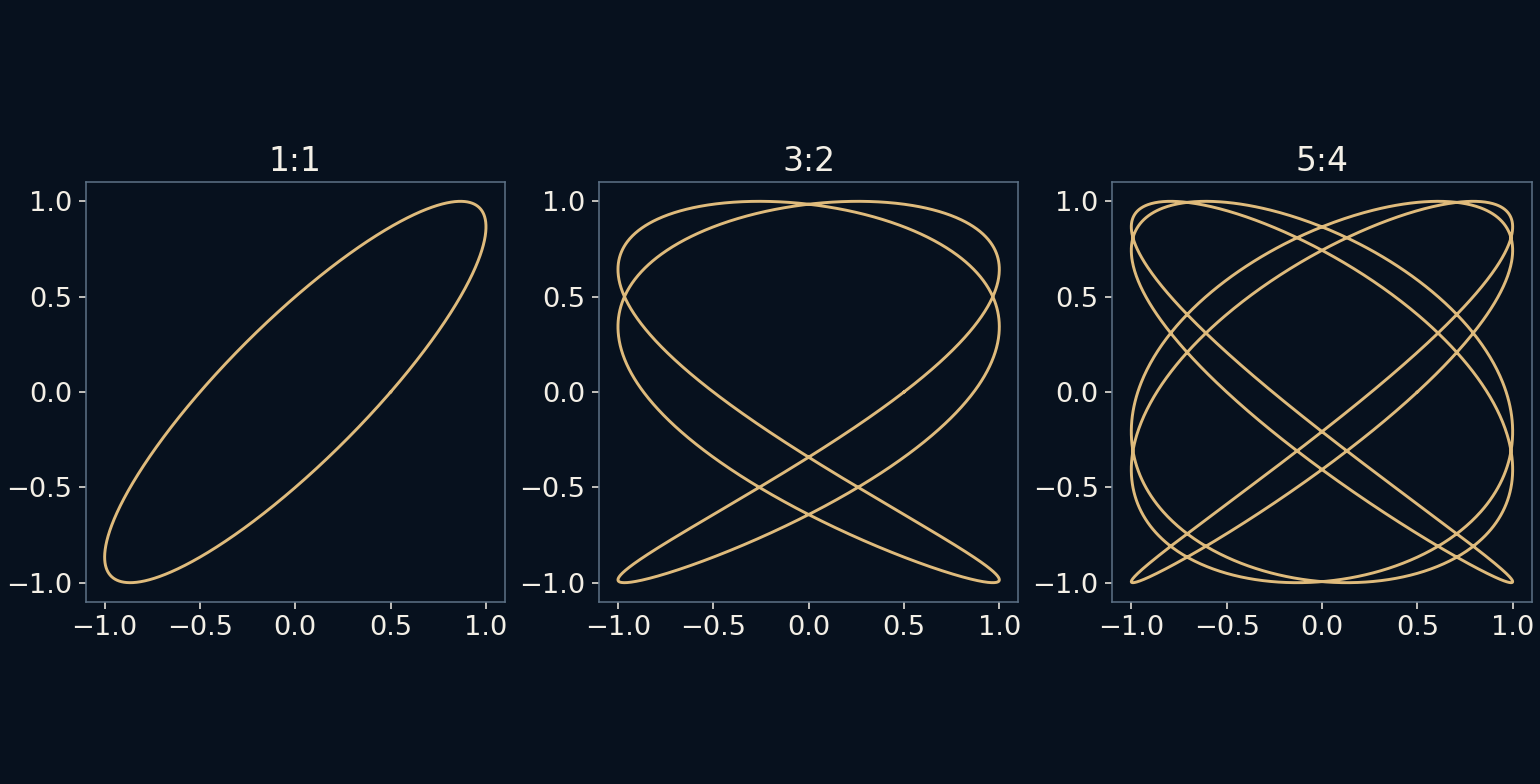
The integer frequencies share a repeat interval. After two pi, each coordinate returns to its initial value with its initial direction of motion. The path closes because both clocks agree at the same moment. The script measures the tiny numerical difference between the final and first coordinates rather than assuming a plotted line is closed merely because it looks connected.
More generally, a rational frequency ratio has a common period. Reducing the ratio to its simplest integers helps identify that period. A ratio of six to four traces the same family of shapes as three to two, although the traversal rate changes for the same parameter convention. Counting crossings alone is not always a reliable way to recover the frequencies.
Phase changes the drawing without changing the ratio
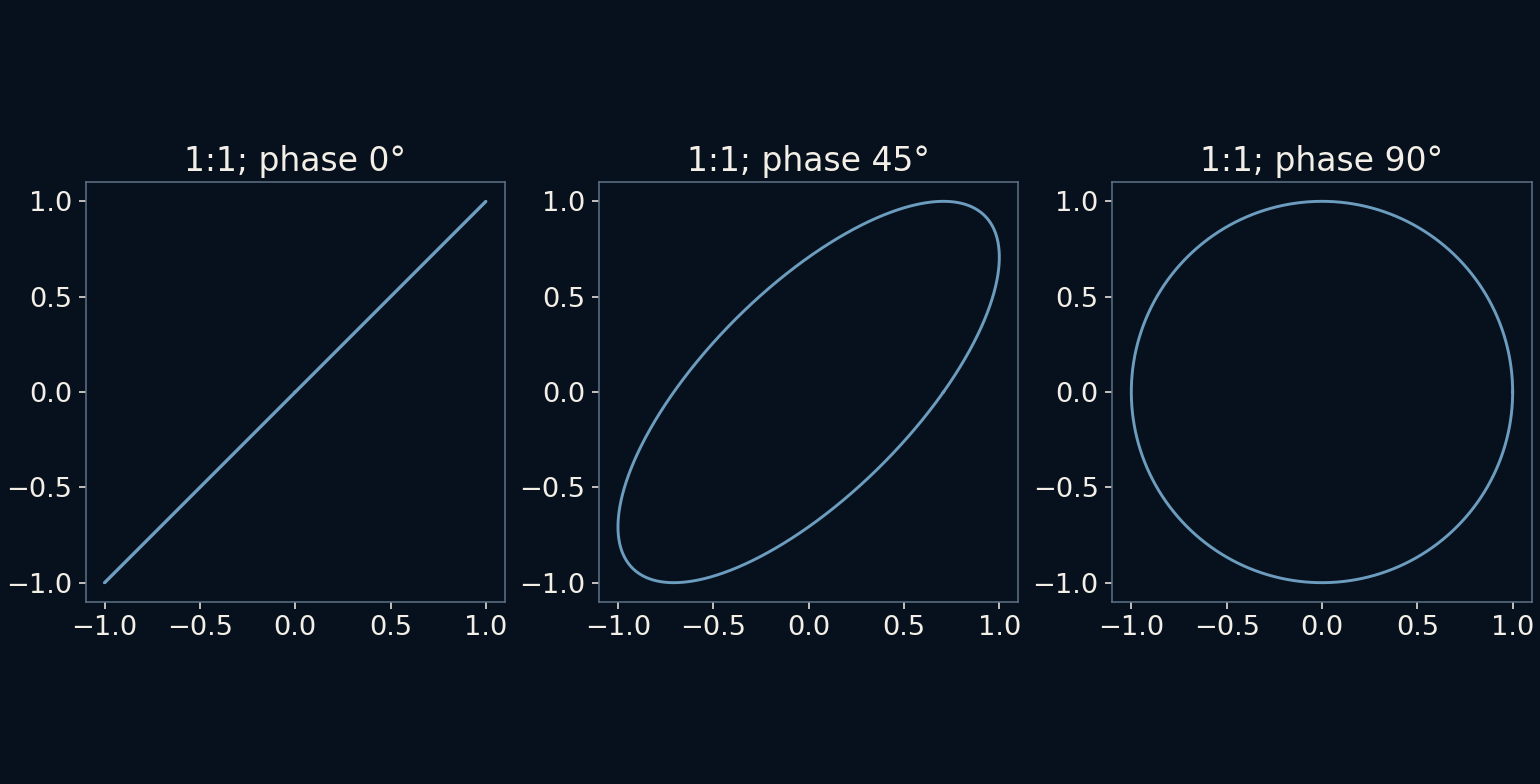
At a one-to-one frequency ratio, equal phases make both coordinates identical, producing a diagonal line. A quarter-cycle offset produces a circle when the amplitudes match. Intermediate offsets produce ellipses. The phase comparison keeps the frequencies and amplitudes fixed so that the change in shape has one clear cause.
For higher ratios, phase shifts can rearrange crossings and change how often parts of the path overlap. Two drawings with the same ratio need not look identical. This is why a Lissajous image is not simply a decorative label for a pair of numbers: timing within the cycles is also part of the specification.
An irrational ratio does not return exactly
If the frequency ratio is irrational, there is no finite common period for the ideal oscillations. The path can come arbitrarily close to earlier positions without returning to exactly the same full phase state. Extending the observation gradually fills more of the allowed region instead of completing one permanently repeating closed track.
A computer still uses finite precision and samples a finite interval. It cannot establish irrationality by staring at a long plot, nor can a nearly closed endpoint prove an exact rational ratio. Our check only confirms that the chosen square-root-of-two example does not close over the particular interval from zero to two pi. The broader statement comes from the mathematics of common periods.
The crossing is not a collision
A point where the drawing crosses itself may represent the pen visiting the same position at different times. A static image hides that timing. It also hides how quickly the pen moves: the combined speed changes as the two coordinate velocities change, even though each frequency parameter stays constant.
An oscilloscope in XY mode can display related figures by using one input for horizontal deflection and another for vertical deflection. In that setting the pattern carries information about the input signals, but noise, calibration and observation duration matter. These illustrations contain exact synthetic functions, not measurements from an instrument or a diagnosis of an electrical signal.
Simple ingredients can preserve a complex relationship
The coordinate plot shows the two waves separately. The looping picture is made from their paired values, not by adding the waves into one signal. That distinction explains why the final curve can look unlike either time trace while remaining completely determined by them.
Lissajous figures offer a compact lesson in representation. A relationship that is awkward to compare along a timeline may become obvious when one changing quantity is plotted against the other. The beauty comes from that change of viewpoint, with no randomness or hidden drawing instructions required.
Further reading
Wolfram MathWorld: Lissajous curve ↗OpenStax: Simple harmonic motion ↗Original documentation and useful background.