A shortcut changes more than the journey of the person standing beside it.
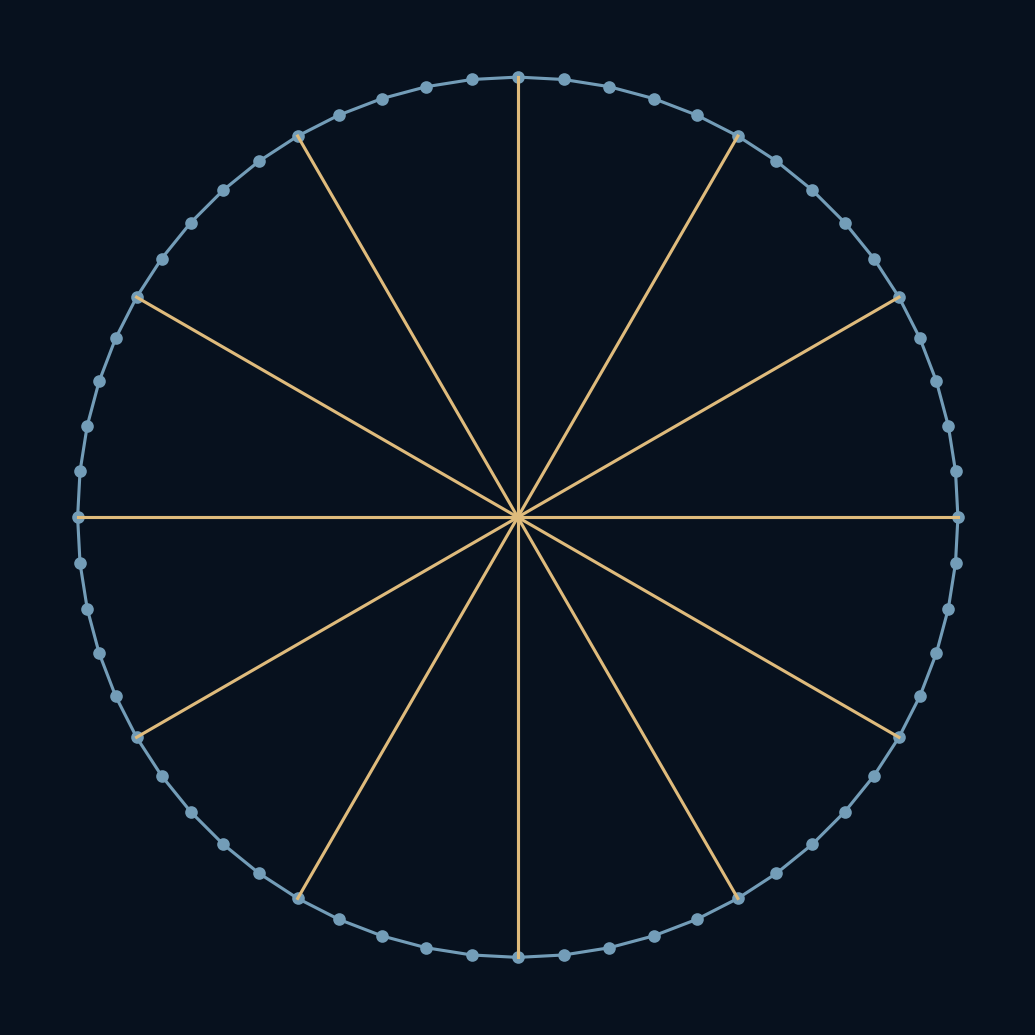
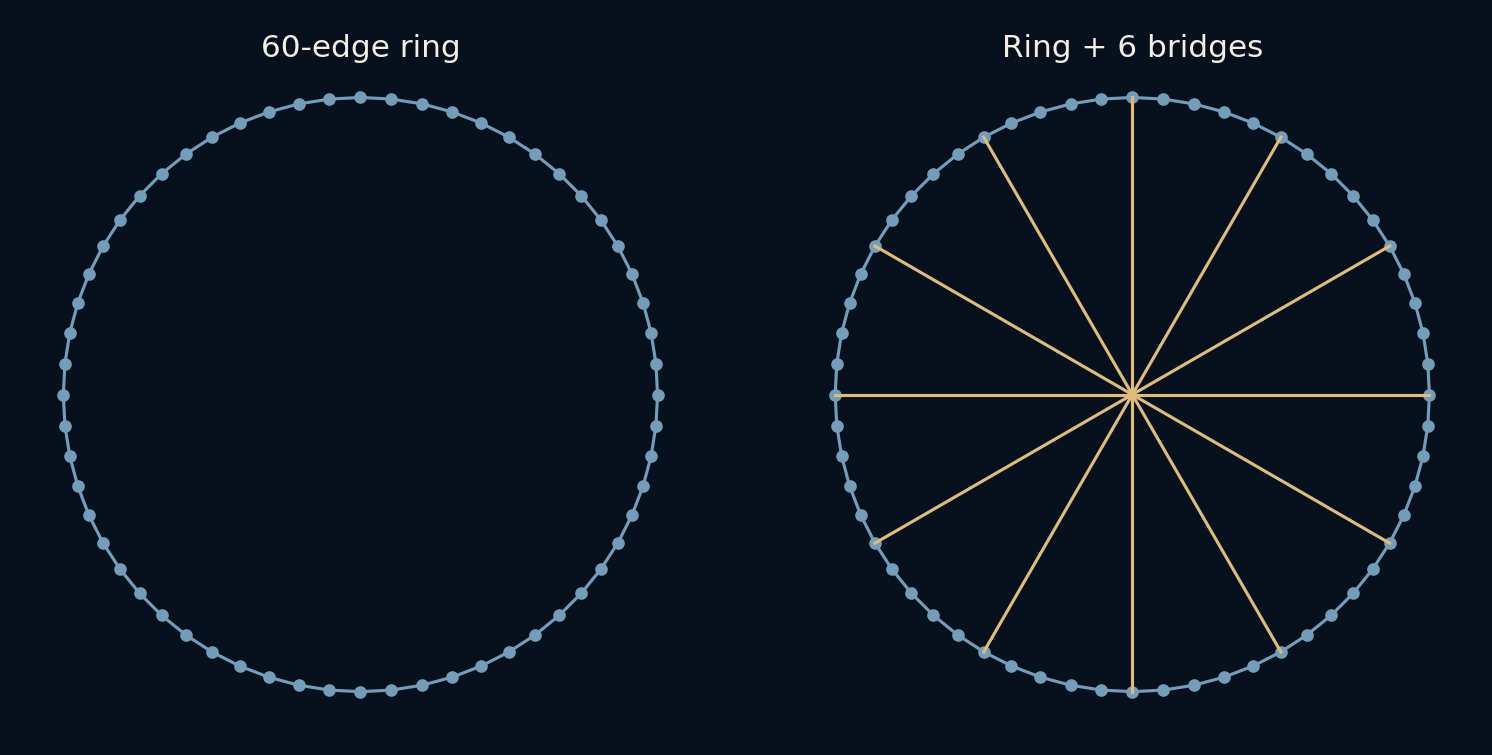
Picture sixty stops arranged around a ring. Each stop connects to its two neighbours, so reaching the opposite side requires a long sequence of little moves. Now add a handful of bridges across the middle. The circle still looks like a circle, but the network has become a different place to travel through. This small example explains why connectivity can matter more than how close things look on a page.
A map tells you where things are. A network also tells you which moves are possible.
Nearby is a rule, not just a position
The starting graph has sixty nodes and sixty undirected edges. Each node connects to the previous and next node around the ring. Every edge costs one hop, regardless of how long it looks in the drawing. There is no travel time, traffic or physical distance hidden in that rule. It is deliberately a very small model.
Between any two nodes there are two ways around the ring. We choose the shorter route. For opposite nodes, both routes require thirty hops. For neighbouring nodes, just one hop is enough. A single attractive example would be easy to select, so the experiment instead calculates shortest paths for all 1,770 unordered pairs of distinct nodes.
A few long links help people far from their endpoints
The new edges join nodes 0–30, 5–35, 10–40, 15–45, 20–50 and 25–55. Node numbers describe positions in this artificial ring, not real locations. The graph now has sixty-six edges. Existing ring connections remain available, which matters: we are adding options, not forcing anyone to replace their original route.
A traveller can walk along the ring to a bridge, cross it, then continue toward the destination. That is why a bridge helps more than its two endpoints. It changes the routes available to many pairs elsewhere. The six links are deliberately selected, not the result of a search proving the best possible bridge layout.
The average journey falls by seven hops
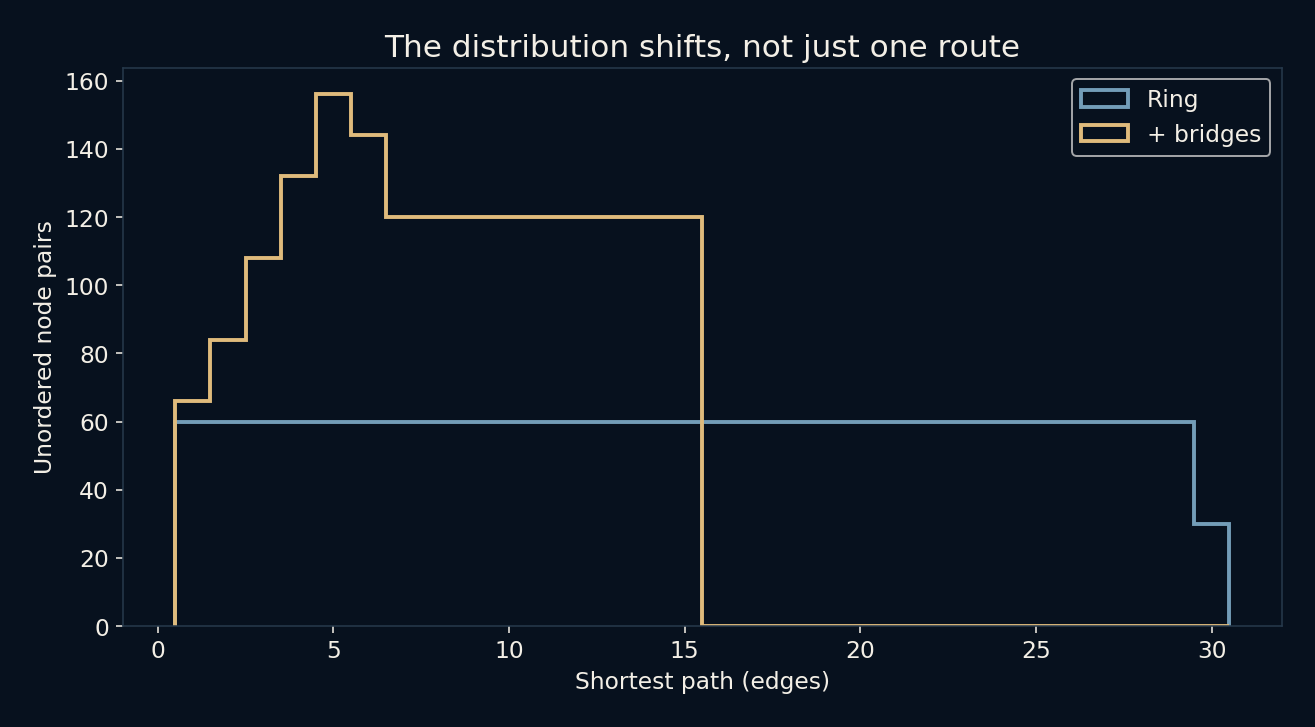
Before the additions, the mean shortest path is about 15.254 hops across all 1,770 pairs. Afterwards it is about 8.254. The difference is exactly seven hops for this graph. The diameter, meaning the largest shortest-path distance between any pair, falls from thirty to fifteen. These are different summaries: one describes the average pair, the other the most separated pair.
Some pairs improve much more than others, while neighbouring nodes still need one hop. The average does not promise the same saving to every traveller. The distance distribution is therefore worth viewing alongside the two headline numbers. It shows which route lengths became more or less common rather than reducing the whole change to a slogan.
Old routes do not disappear
In this fixed, unweighted graph, adding an edge cannot increase a pair's shortest distance. The old best route still exists, and there might now be a better one. Our check compares every pair before and after the additions rather than merely checking the average. Both graphs are connected, and the edge count also confirms that exactly six new connections were added.
That guarantee depends on the model. Real drivers can change their choices when a road opens; congestion can then change journey times. Communication links have capacity and delay. We have modelled none of that. The graph result is a statement about available paths with fixed costs, not a universal promise that every new road or connection improves a real system.
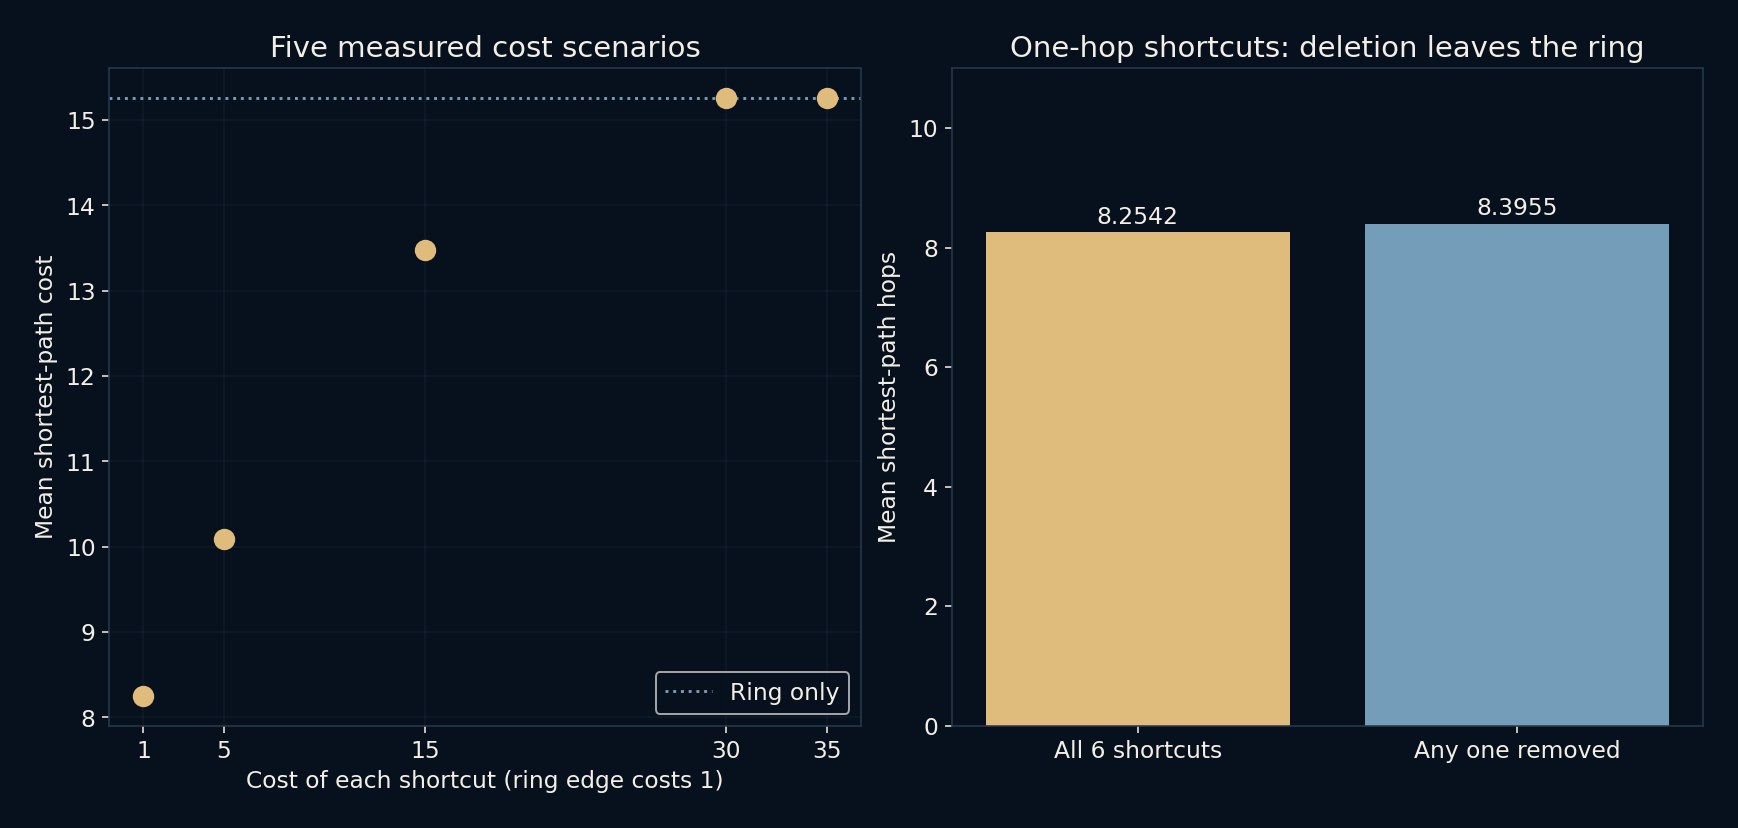
A separate failure test removes each of the six one-hop shortcuts in turn. All sixty nodes remain connected because the entire ring is still present. The mean rises from 8.2542 to 8.3955 hops, while the diameter remains fifteen in all six cases. The equality across deletions reflects this layout’s rotational symmetry, not a general law about redundant networks. Also, “bridge” here is a visual name for a shortcut. In graph theory, a bridge specifically means an edge whose removal disconnects a graph; these added edges do not meet that definition.
A long line may be one cheap step, or an expensive mistake
All six bridges cost one hop here, despite being drawn across the whole circle. That assumption produces much of their benefit. If a crossing cost twenty minutes while a ring edge cost one minute, a time-based calculation would tell a different story. A network drawing can hide this choice because our eyes naturally interpret line length as effort.
The same distinction helps when thinking about links between documents, software components or transport stations. Before asking for the shortest path, choose what an edge means and what its cost represents. Fewer clicks, fewer transfers and less elapsed time are three different objectives. The nicest-looking line on the diagram does not get to choose the objective for us.
A crossing can be shorter on the page and worse in the graph
The extension keeps every ring edge at cost one but assigns each shortcut a cost of 1, 5, 15, 30 or 35 in five separate scenarios. Weighted shortest paths are recomputed for all 1,770 pairs rather than multiplying the old hop average by a new price. The mean costs are approximately 8.2542, 10.0847, 13.4746, 15.2542 and 15.2542. As crossings become expensive, the benefit fades even though the diagram would look unchanged. A path with fewer edges can now be the costlier choice.
At cost 30, each shortcut ties the thirty-edge ring route between its own opposite endpoints. Any route using that shortcut can replace it with the ring segment at no extra cost. The script confirms that every pair, not just the average, returns to its ring-only shortest cost. Raising crossings to 35 cannot help because those replacements become cheaper still. This is a useful break-even question for any path model: what does the proposed connection cost compared with an already available route? The answer requires edge weights, not a dramatic-looking line across a circle.
An illustration of shortcuts, not a theory of everyone
This ring is not evidence for how many acquaintances connect real people, nor does it measure internet performance. Real networks can have directed edges, unequal importance, changing availability and highly uneven degrees. A small-world discussion can begin with an example like this, but it cannot end by treating sixty invented dots as a survey of society.
What the experiment does offer is a clear habit of thought: count the whole network, keep the cost assumptions visible, and distinguish an average improvement from an improvement for each person. The surprising part is already there without a grander claim. Six connections changed the routes between hundreds of pairs, even though none of the nodes moved.
Further reading
NetworkX: average shortest-path length ↗NetworkX: graph diameter ↗Original documentation and useful background.