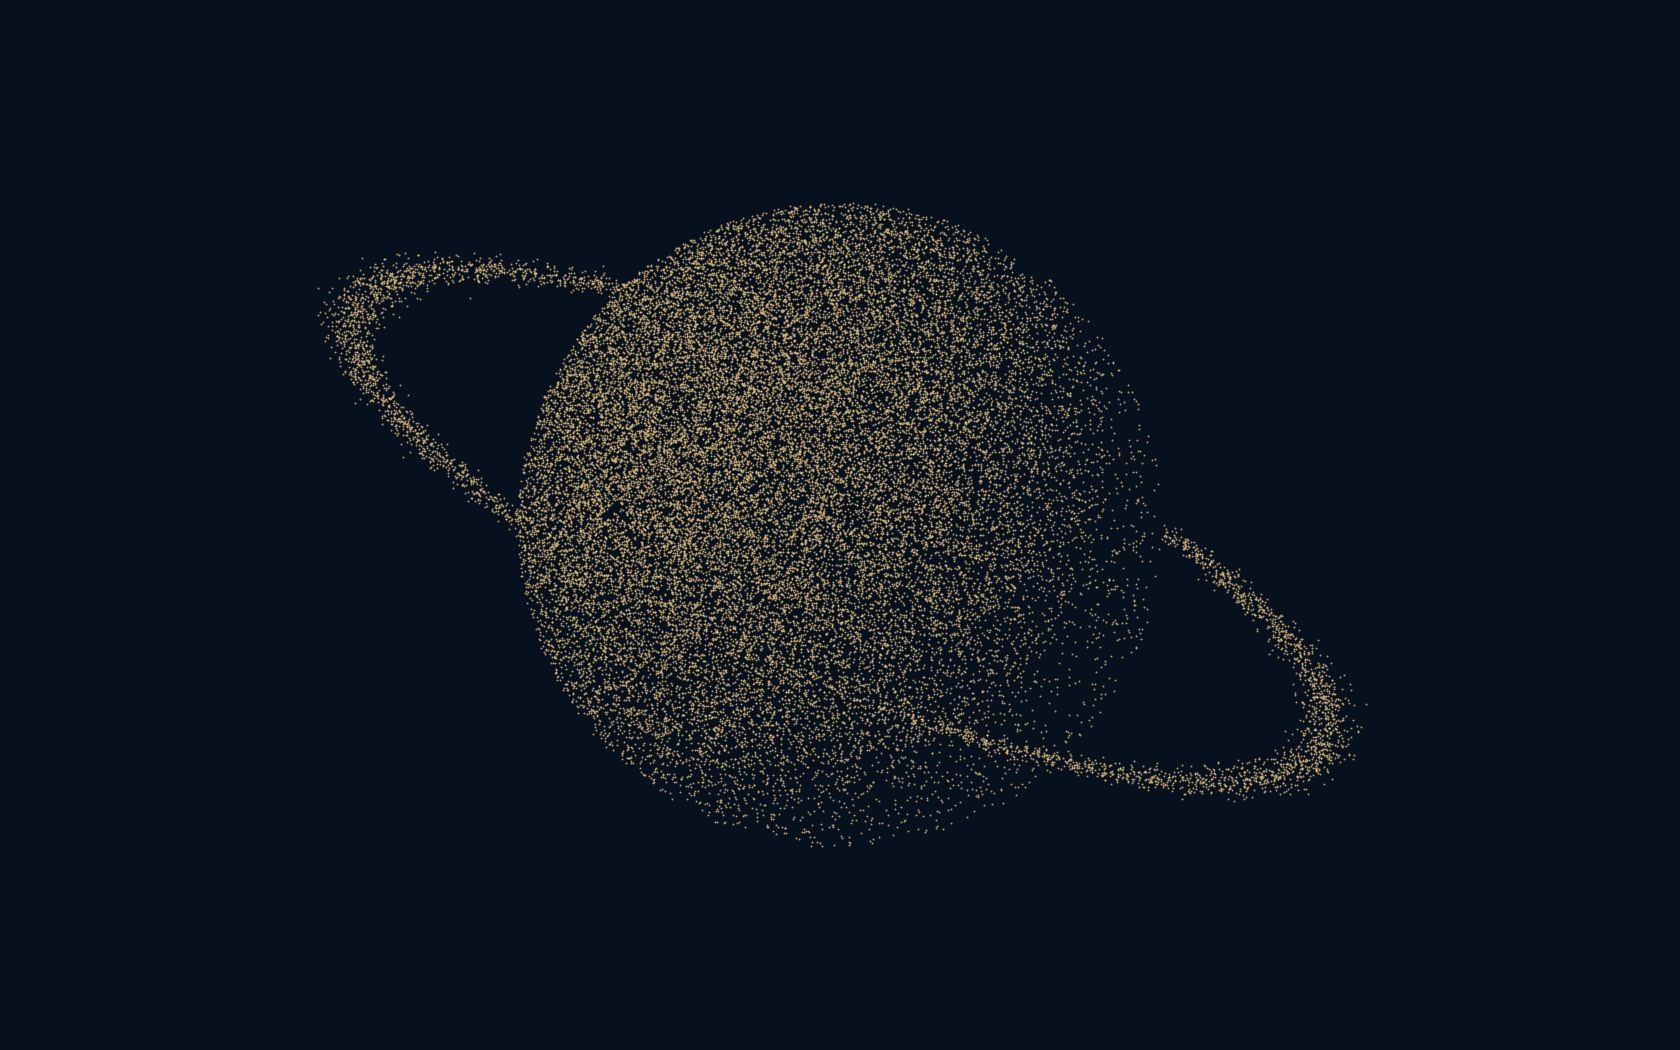
No individual dot knows it belongs to a planet. Together, they draw one.
The rule is almost disarmingly small: give brighter parts of a source image a greater chance of receiving a point. Repeat that choice thousands of times. An illuminated globe and a thin ring emerge from decisions that are random locally and carefully directed overall. The design lives in the probabilities.
Randomness can follow a plan without losing its irregularity.
Equal chances produce equal attention
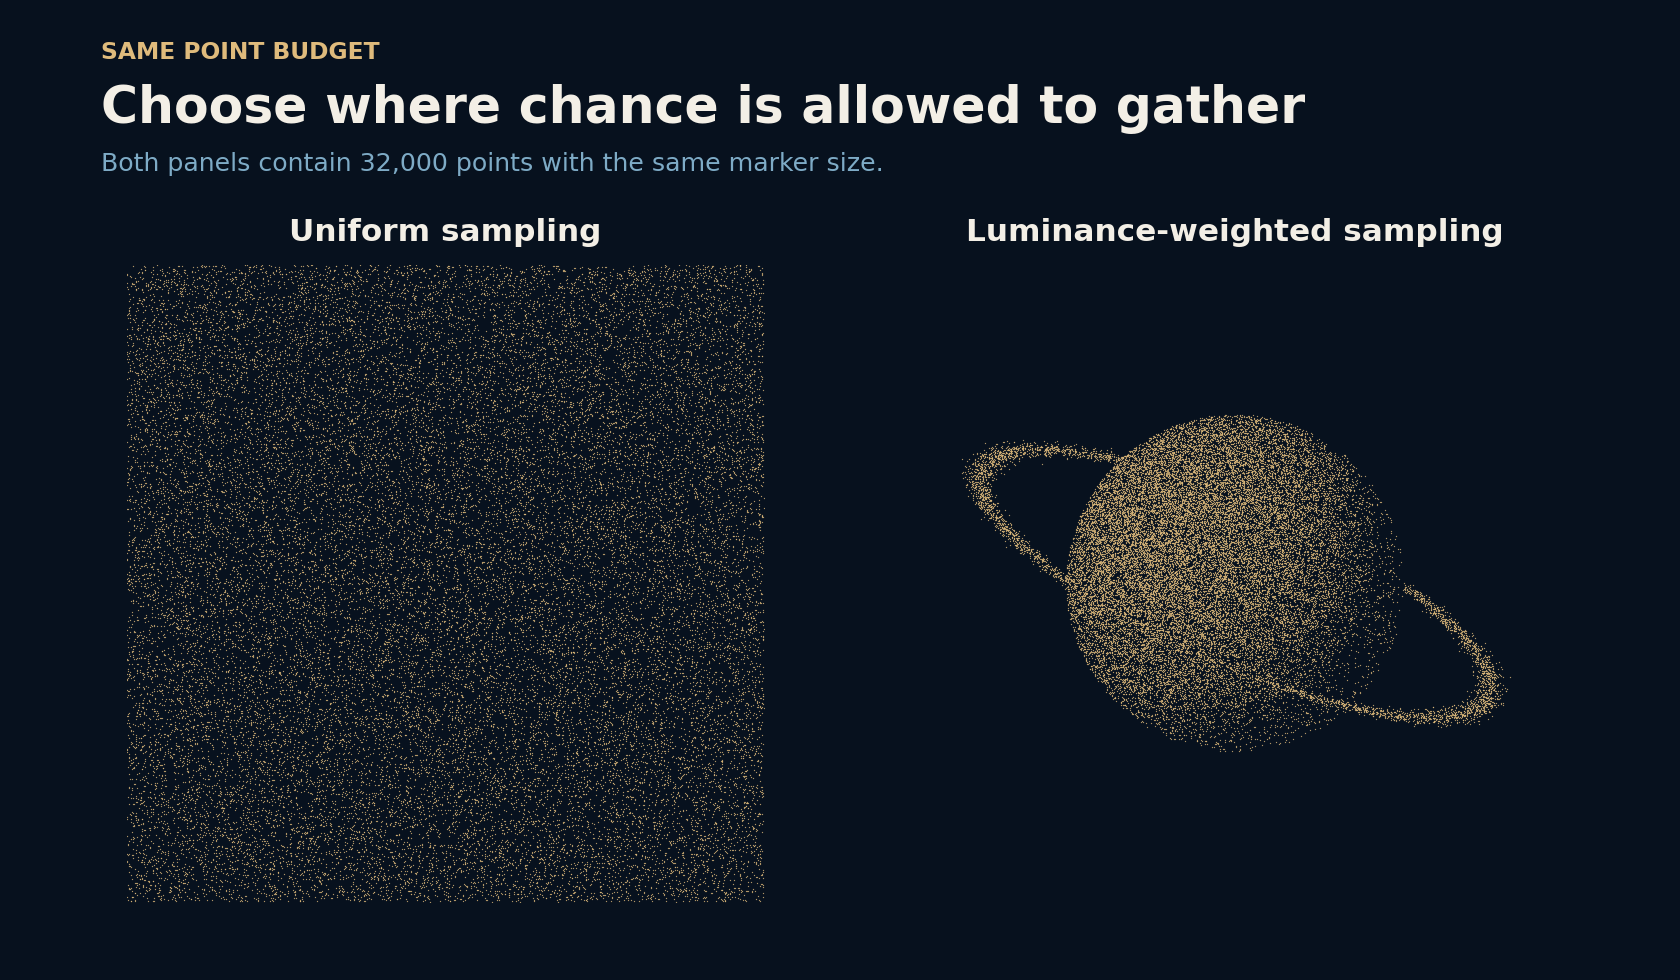
Scatter points uniformly across a square and every equal-area patch has the same expected share. Some patches will be busier than others by chance, but there is no reason for the whole cloud to form a planet. Our uniform panel uses the same 32,000-point budget and marker size as the weighted panel. The difference is where those points are allowed to gather.
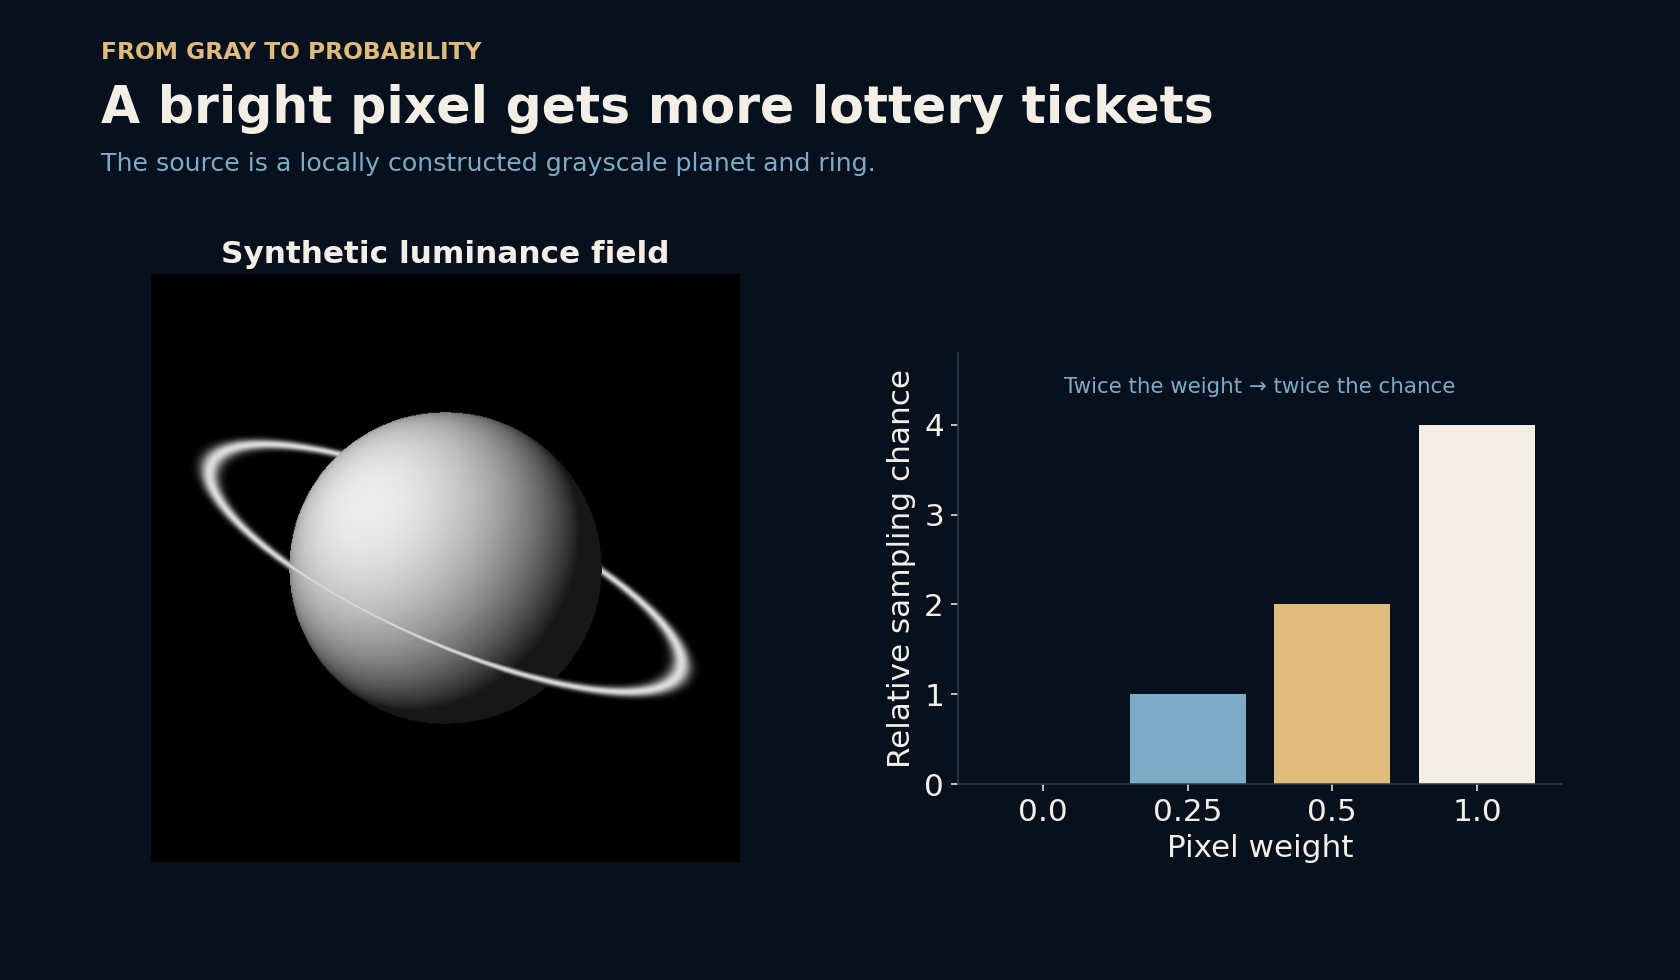
The target was built locally from a shaded circular body and an elliptical ring. It is a deliberately constructed grayscale field, not a photograph recovered from hidden information.
Turn brightness into lottery tickets
Each pixel receives a nonnegative luminance weight. Divide a pixel’s weight by the sum of all weights to obtain its selection probability. A pixel with twice the weight has twice the chance of being chosen. We repeatedly draw a pixel, then add a small random position within it so the dots are not locked to the pixel centers.
A weight of exactly zero means zero chance: that background never receives a weighted sample. Very faint but positive ring falloff remains eligible, even where a displayed preview looks black. The source must have a positive total weight; an entirely black input would need an explicit fallback. Here the bright sphere and ring guarantee a positive total.
Fix the seed to hold the experiment still
Random does not have to mean impossible to repeat. The local test uses seed 2026 with a pseudorandom generator. Running the same sampling procedure again on the same target produced exactly the same point coordinates. That makes it possible to change a drawing choice while keeping the underlying points fixed, rather than confusing a new layout with a new random draw.
A seed is not the entire recipe. The generator, input field, sampling method, number of points, and order of random draws also matter. Our procedure first samples pixel indices with replacement, then generates subpixel offsets. Another implementation can use the same seed number and produce a different image. Reproducibility belongs to the full procedure, not the memorable integer alone.
The image is visible in the statistics too
Define the bright foreground as pixels with weight above 0.15. It occupies 21.20 percent of the canvas, but holds 97.14 percent of the total sampling weight. In the actual weighted draw, 97.16 percent of points landed there. The uniform draw put 21.33 percent there, close to the foreground’s area share instead.
These figures check the intended mechanism: the weighted sampler follows brightness mass, while the uniform sampler follows area. They do not prove that every fine detail is accurate or that viewers will prefer this result. The threshold simply creates a clear region we can count. It is used for the test, not to cut off dim pixels during sampling.
More points reveal the shading
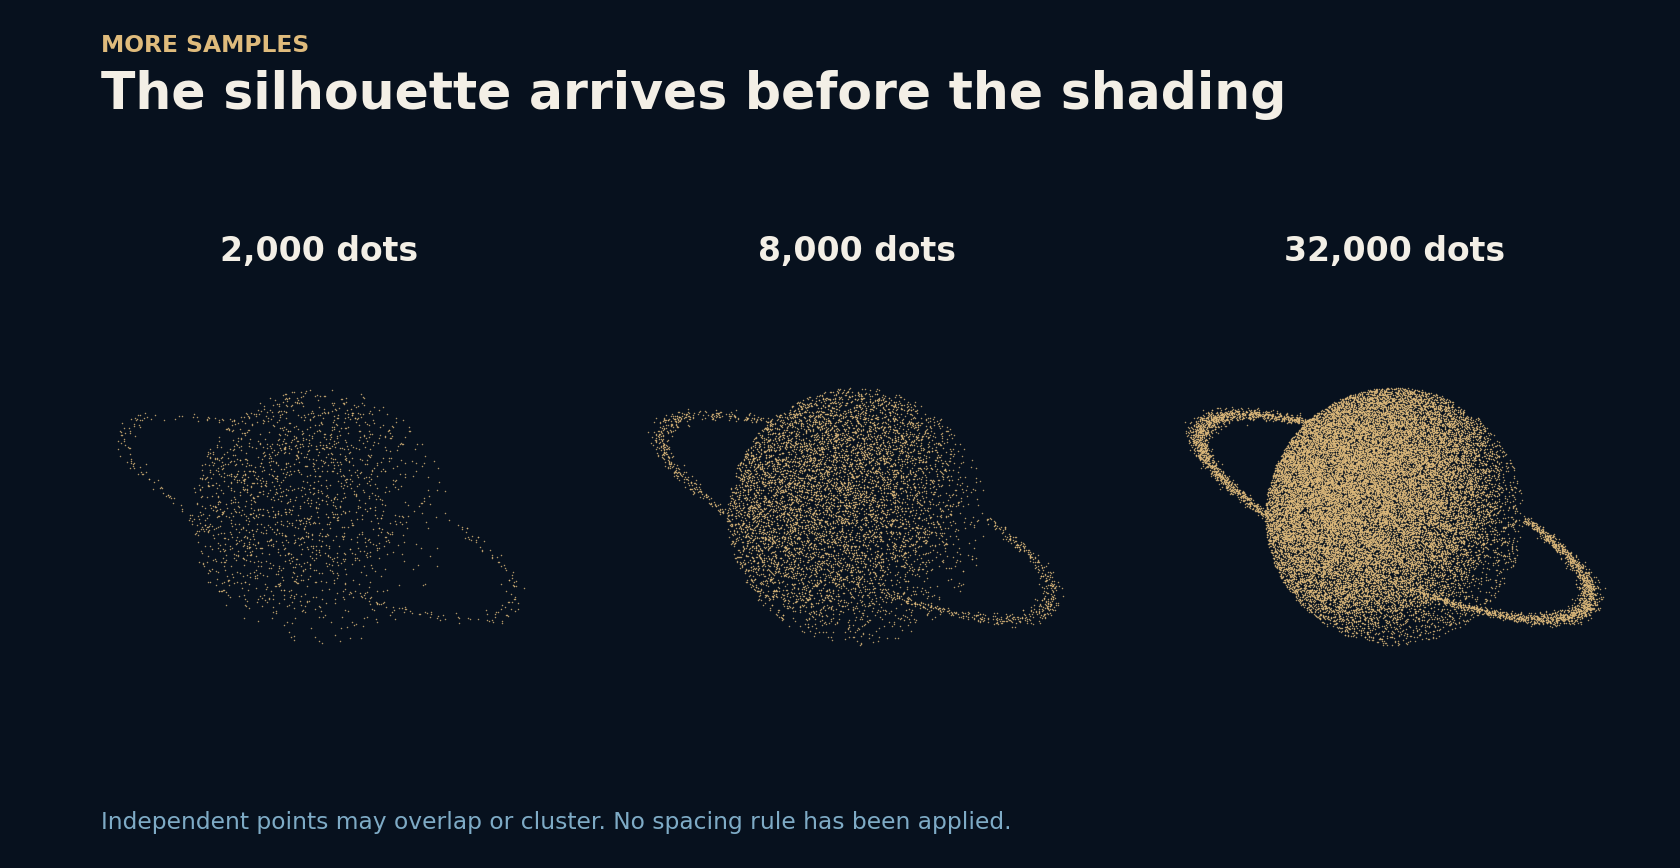
At 2,000 points, the silhouette already appears. At 8,000 and 32,000, the distribution becomes denser and local shading is easier to read. Counting points in a coarse 20 × 20 grid gives another check. Correlation between the measured counts and the target’s integrated weights rose from 0.9728 to 0.9985 between the smallest and largest tested draws.
That is a result for this target and seed, not a promise that every extra point improves a drawing. The plots keep marker size fixed, so adding points also makes the displayed object brighter. Dot size, opacity, overlap, and background color all affect the final appearance. Matching the expected point density is different from reconstructing the source’s exact brightness.
Clumps are part of this particular texture
Sampling with replacement permits repeated selections of the same pixel. Independent points can sit very close together or leave small gaps. That grain is part of the look, but it can also hide fine lines or make an area uneven. This experiment does not enforce a minimum distance between dots or perform any later relaxation.
A different stippling method might spread marks more evenly, vary their size, or place dark dots on a light background using inverted weights. Each choice changes the visual language and sometimes the statistics. The useful discovery here is smaller and more portable: a simple probability field can turn chance into a drawing material you can reason about.
Further reading
NumPy Generator.choice: weighted sampling and replacement ↗NumPy random generators and reproducibility ↗NumPy random compatibility policy ↗Original documentation and useful background.