
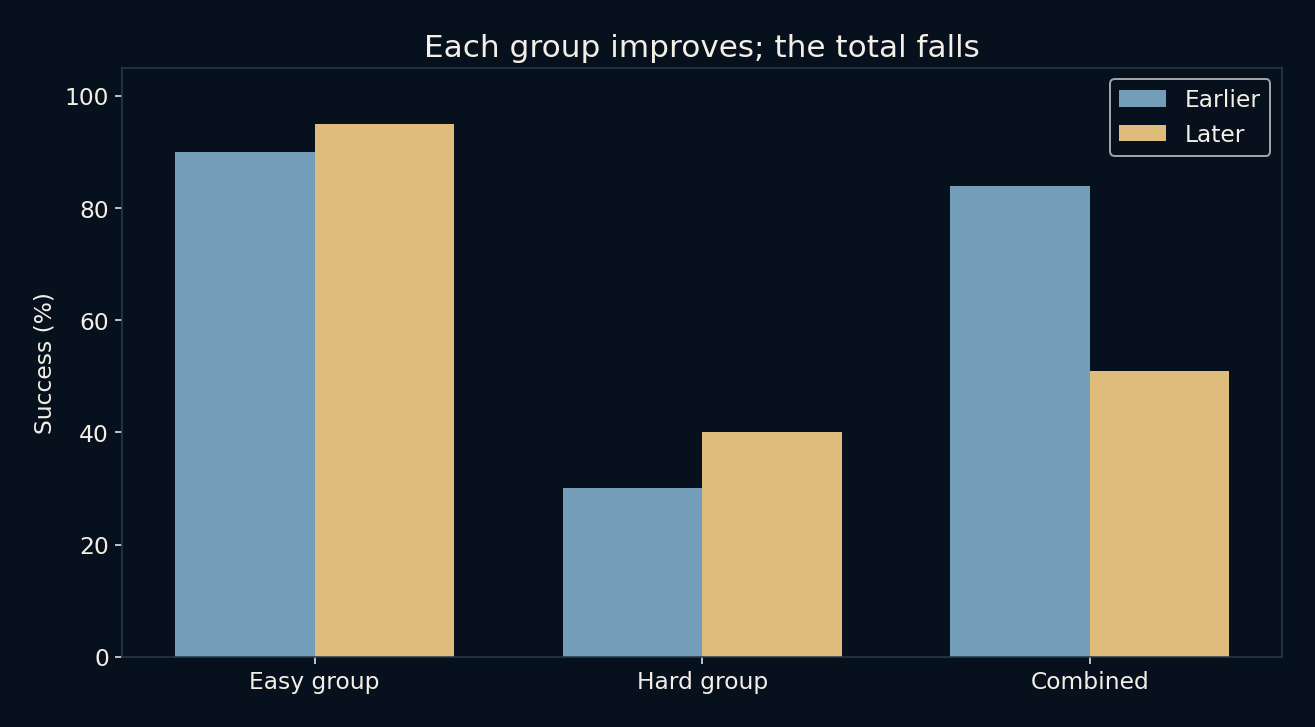
Ninety becomes ninety-five. Thirty becomes forty. Yet eighty-four becomes fifty-one.
Those numbers are not a broken spreadsheet. They belong to a small invented service that handles easy and hard cases. Both groups improve between two periods, but the combined success rate drops sharply. The arithmetic is consistent because the second period contains many more hard cases. An overall percentage carries the composition of its population inside it, usually without advertising the fact.
Every combined rate has a set of weights hiding underneath.
Keep the denominators attached
In the earlier period, the service succeeds on 81 of 90 easy cases and 3 of 10 hard cases. Those rates are 90% and 30%. The total is 84 successes among 100 cases, or 84%. Most of the work comes from the easier group, so its higher success rate dominates the headline.
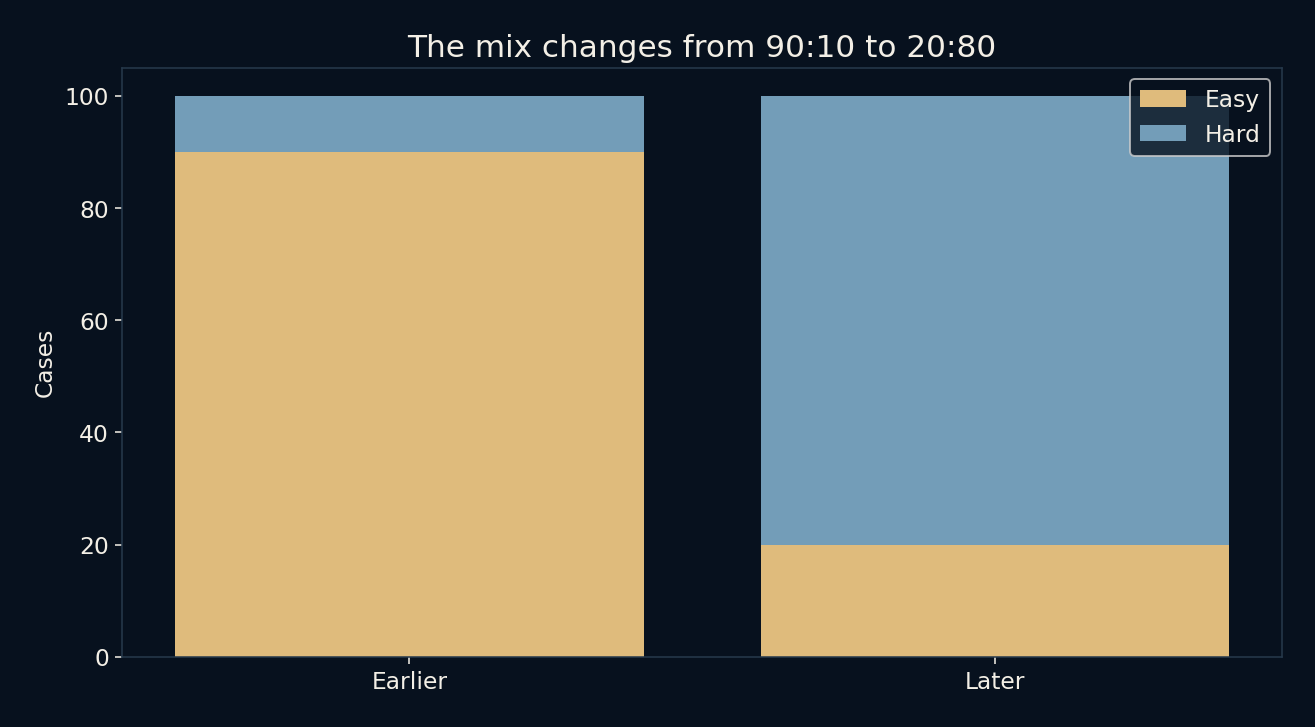
Later, the service succeeds on 19 of 20 easy cases and 32 of 80 hard cases. The group rates rise to 95% and 40%. But the total is only 51 successes among 100 cases. The easy workload has shrunk while the hard workload has expanded. Nothing in the calculation requires either group to deteriorate.
A total is a weighted average
The earlier overall rate gives the easy group a weight of 90% and the hard group 10%. The later rate gives them weights of 20% and 80%. Multiplying each group rate by its share of cases and adding the products reproduces the total. The percentage is doing two jobs at once: describing performance and reflecting who arrived.
An ordinary average of the two group percentages would answer a different question. Giving each group equal weight produces 60% earlier and 67.5% later. That comparison holds the mix fixed at half easy and half hard. It reveals improvement for that chosen reference population, but it is not the success rate actually experienced by all cases in either period.
Two summaries can both deserve attention
Someone assessing whether the service improved within comparable groups may care about the group rates or a clearly defined standardized comparison. Someone planning follow-up work may care about the actual 49 unsuccessful cases in the later period. The same data can support both concerns. Choosing one summary does not erase the other.
This is why attaching a label such as “better” to a single percentage can create an argument that arithmetic alone cannot settle. Better for which population, under which workload, and for which decision? The denominator and reference mix should be visible before the rate is used to reward a team, compare systems or explain a change.
Splitting data does not automatically reveal the truth
The example is a version of Simpson’s reversal, but seeing a reversal does not tell us which variables ought to be controlled. In real data, a grouping variable might explain case difficulty, reflect the consequences of a decision, or introduce a new selection problem. Its role has to be understood from how the data were generated.
Our labels “easy” and “hard” are stipulated. There is no experiment assigning cases, no measurement of hidden differences and no claim that a particular intervention caused improvement. The count table isolates a mathematical mechanism. Causal conclusions would need additional design and evidence, not merely a more detailed spreadsheet.
Ask what changed besides the percentage
A practical first check is to request successes and totals rather than percentages alone. Then compare group sizes across periods and calculate a fixed-mix summary if that matches the decision. Small groups also deserve uncertainty estimates in real applications. A change from 18 to 19 successes out of 20 should not be treated as a precise population improvement.
For this constructed example, the counts are exact fixtures rather than noisy observations from a sampled population. They make the reversal easy to inspect. The broader reading habit remains useful: when an overall trend contradicts its parts, inspect the weights before looking for an error. Sometimes the total is describing a different crowd.
Further reading
Stanford Encyclopedia of Philosophy: Simpson’s paradox ↗NumPy: weighted averages ↗Original documentation and useful background.