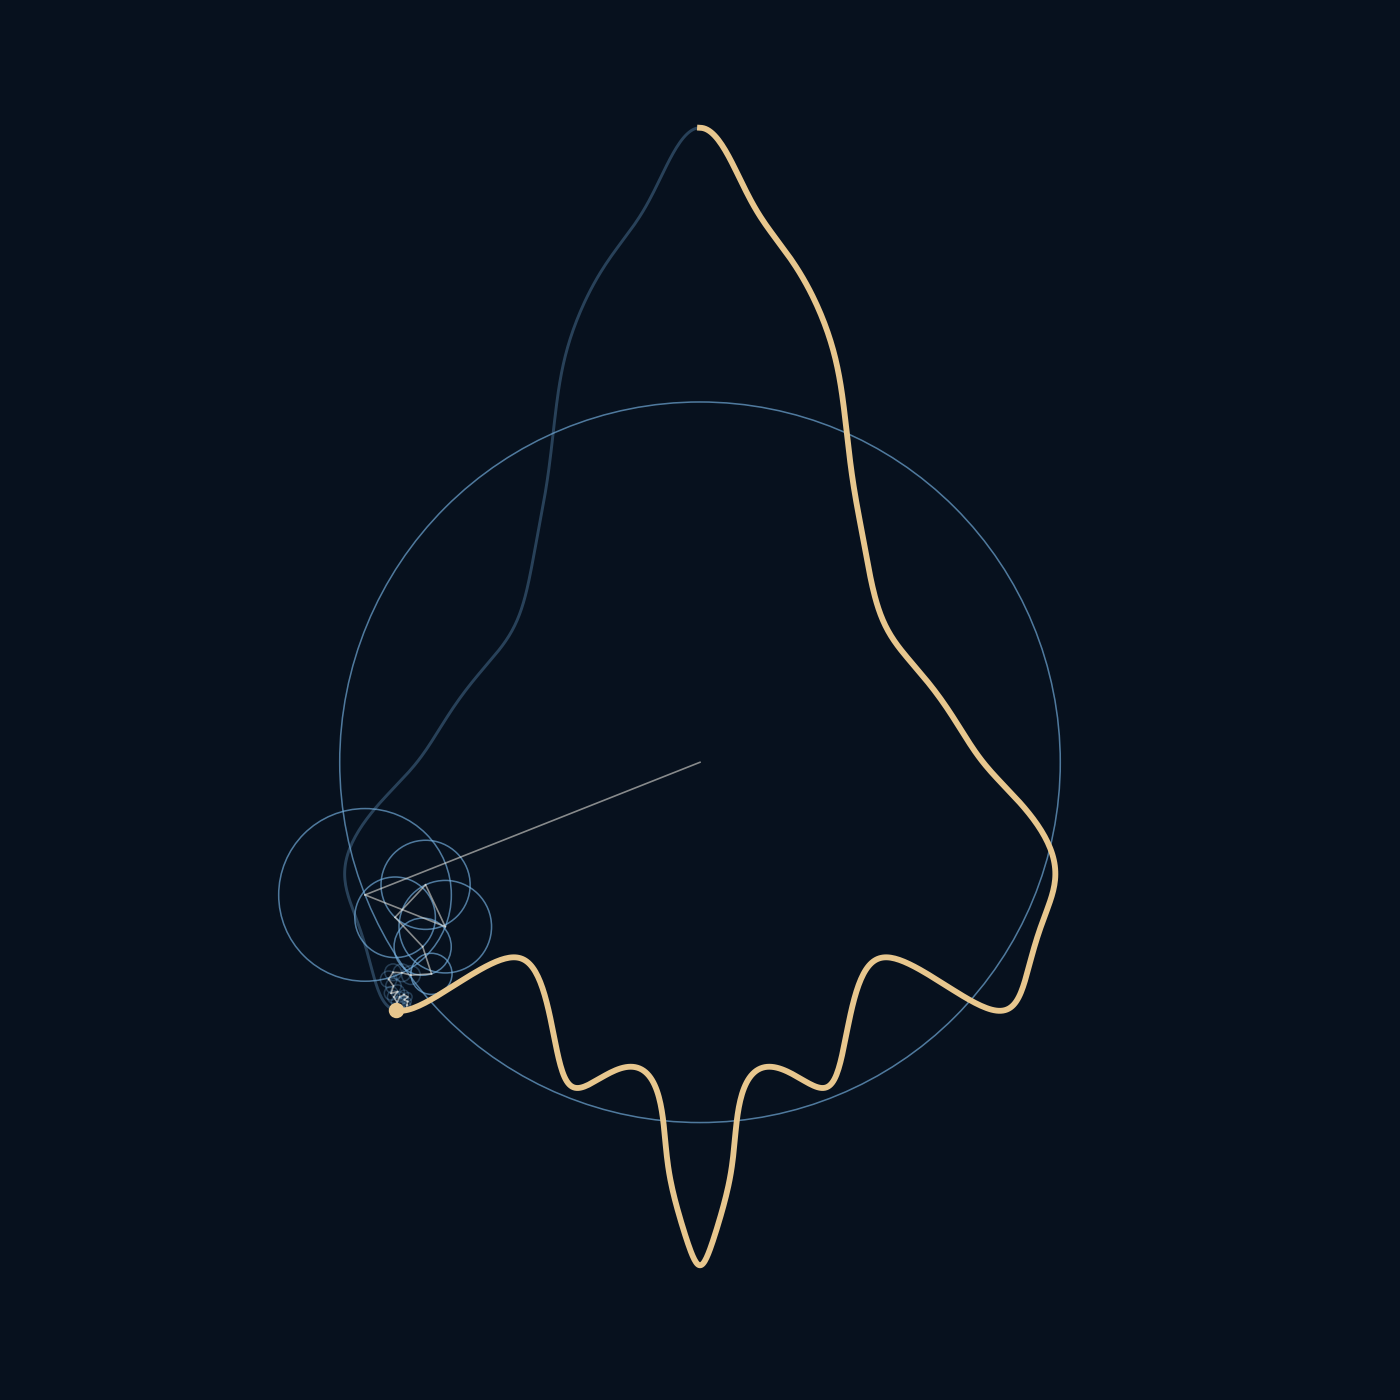
A circle can only go around. So how does a collection of circles turn a corner?
Put a pencil at the end of a rotating arm and you get a circle. Attach another rotating arm to its tip and the pencil starts doing something more interesting. Add enough arms, choose their lengths and speeds carefully, and the pencil can trace a surprisingly familiar shape. A rocket, for example.
The circles never learn the shape. They follow a very good set of instructions.
A drawing, disguised as movement
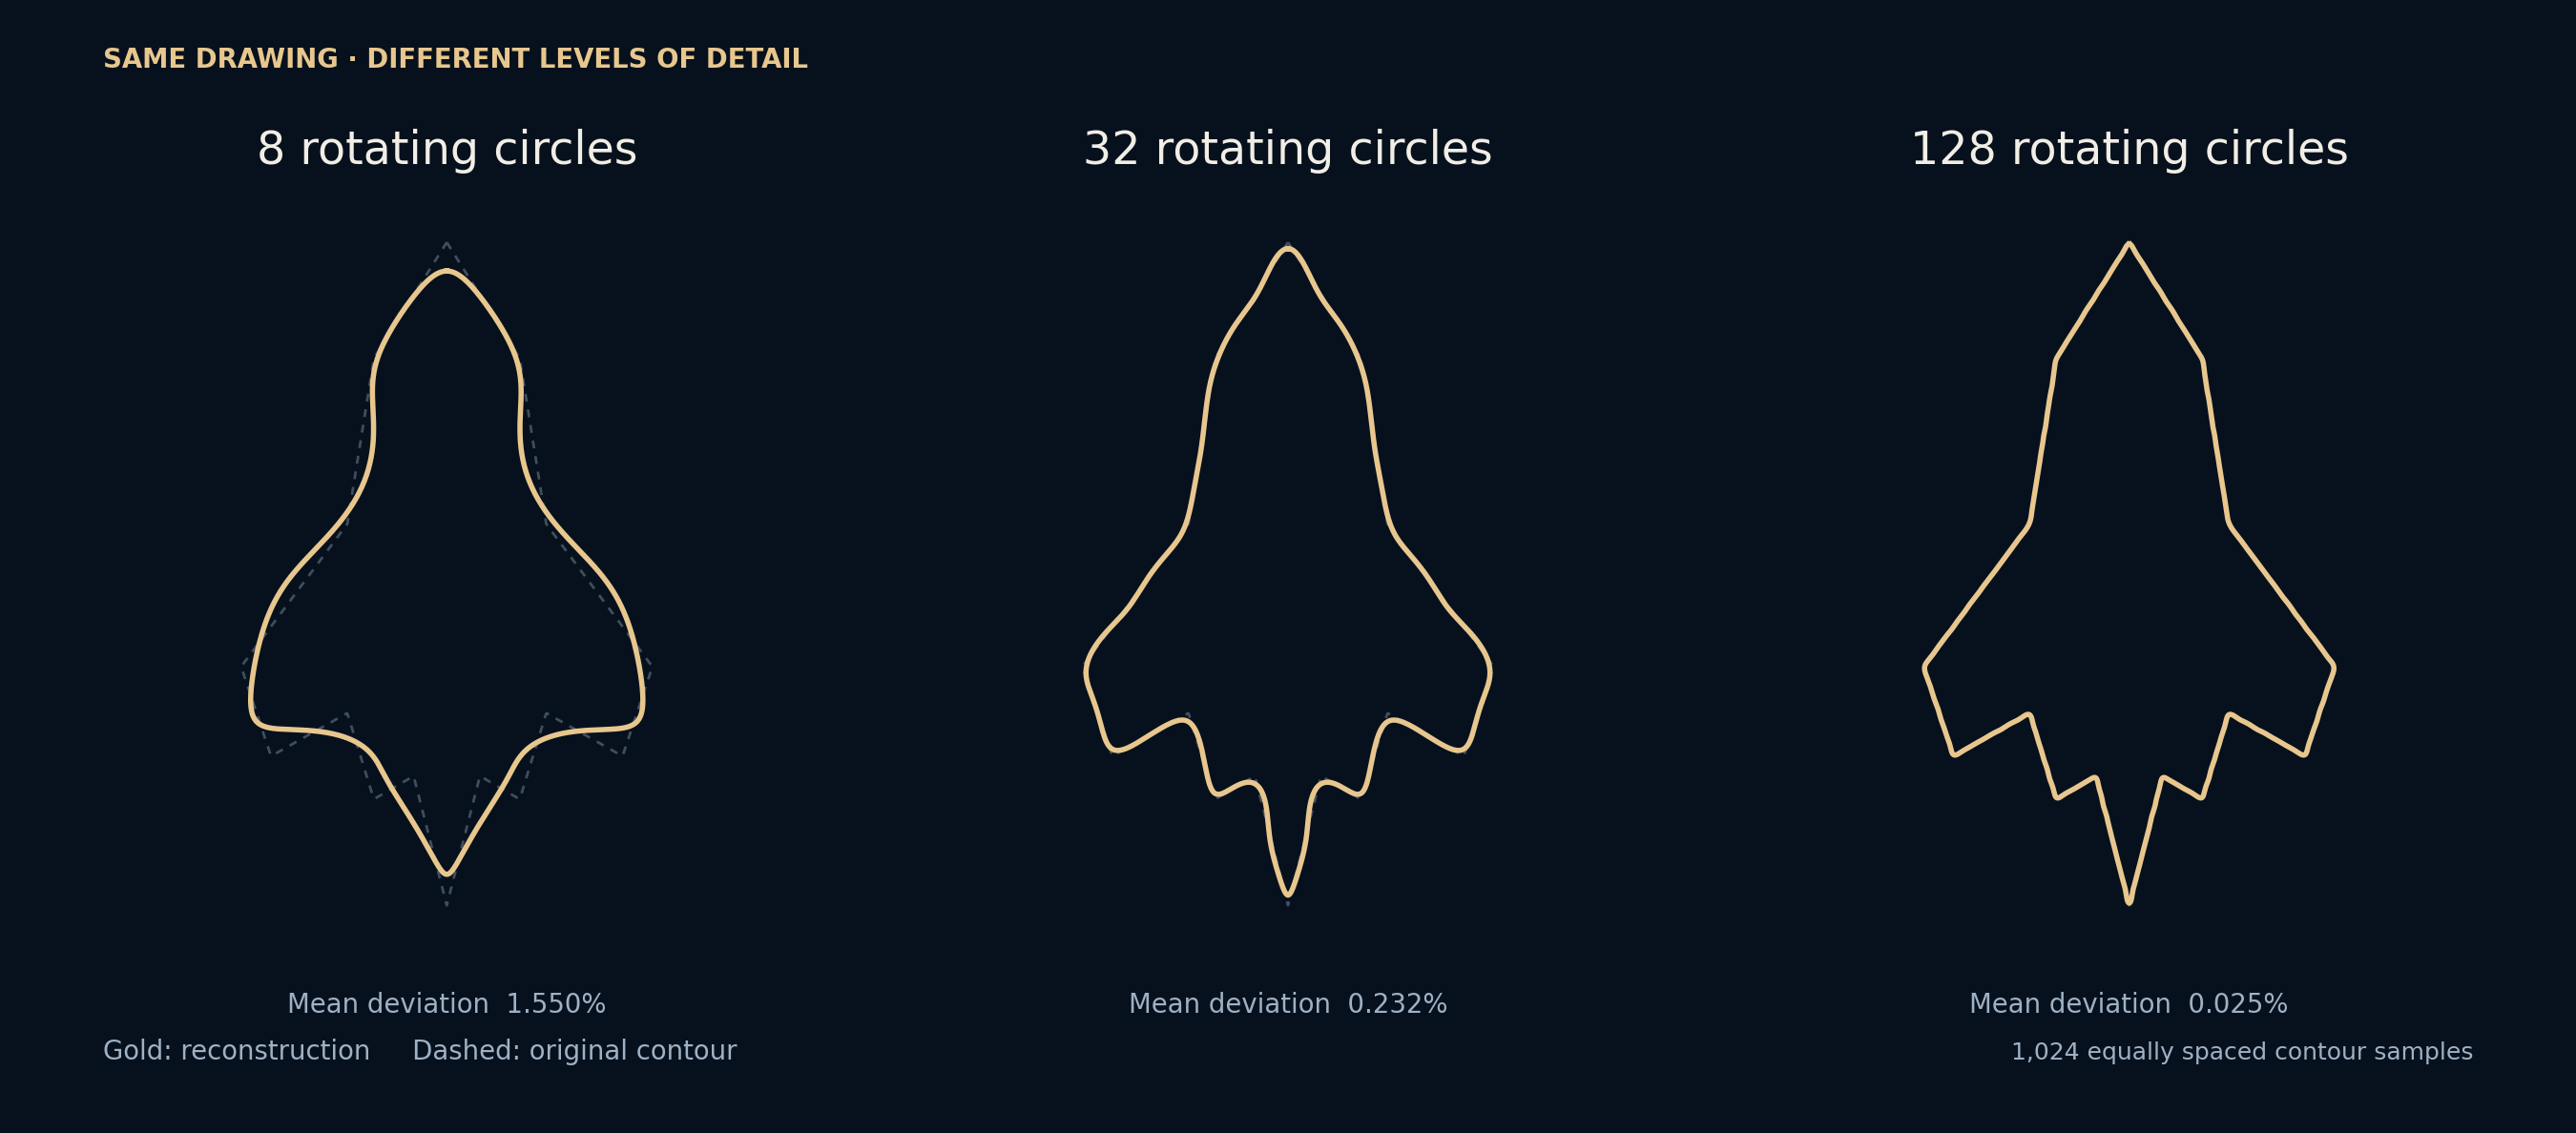
Forget the rocket for a moment. Imagine a tiny light travelling once around its outline. At every instant, the light has a horizontal position and a vertical position. Together, those two numbers describe the entire trip.
Fourier analysis asks a different question: could the same trip be assembled from simpler movements? In this case, the simple movement is rotation. Every rotating arrow contributes a little push. Add their horizontal and vertical contributions, and the final tip gives you a point on the drawing.
This is related to separating a musical chord into its notes. Only here, the thing being separated is a path rather than a sound. The picture is still a picture. We have just found another way to describe it.
Each circle gets three instructions
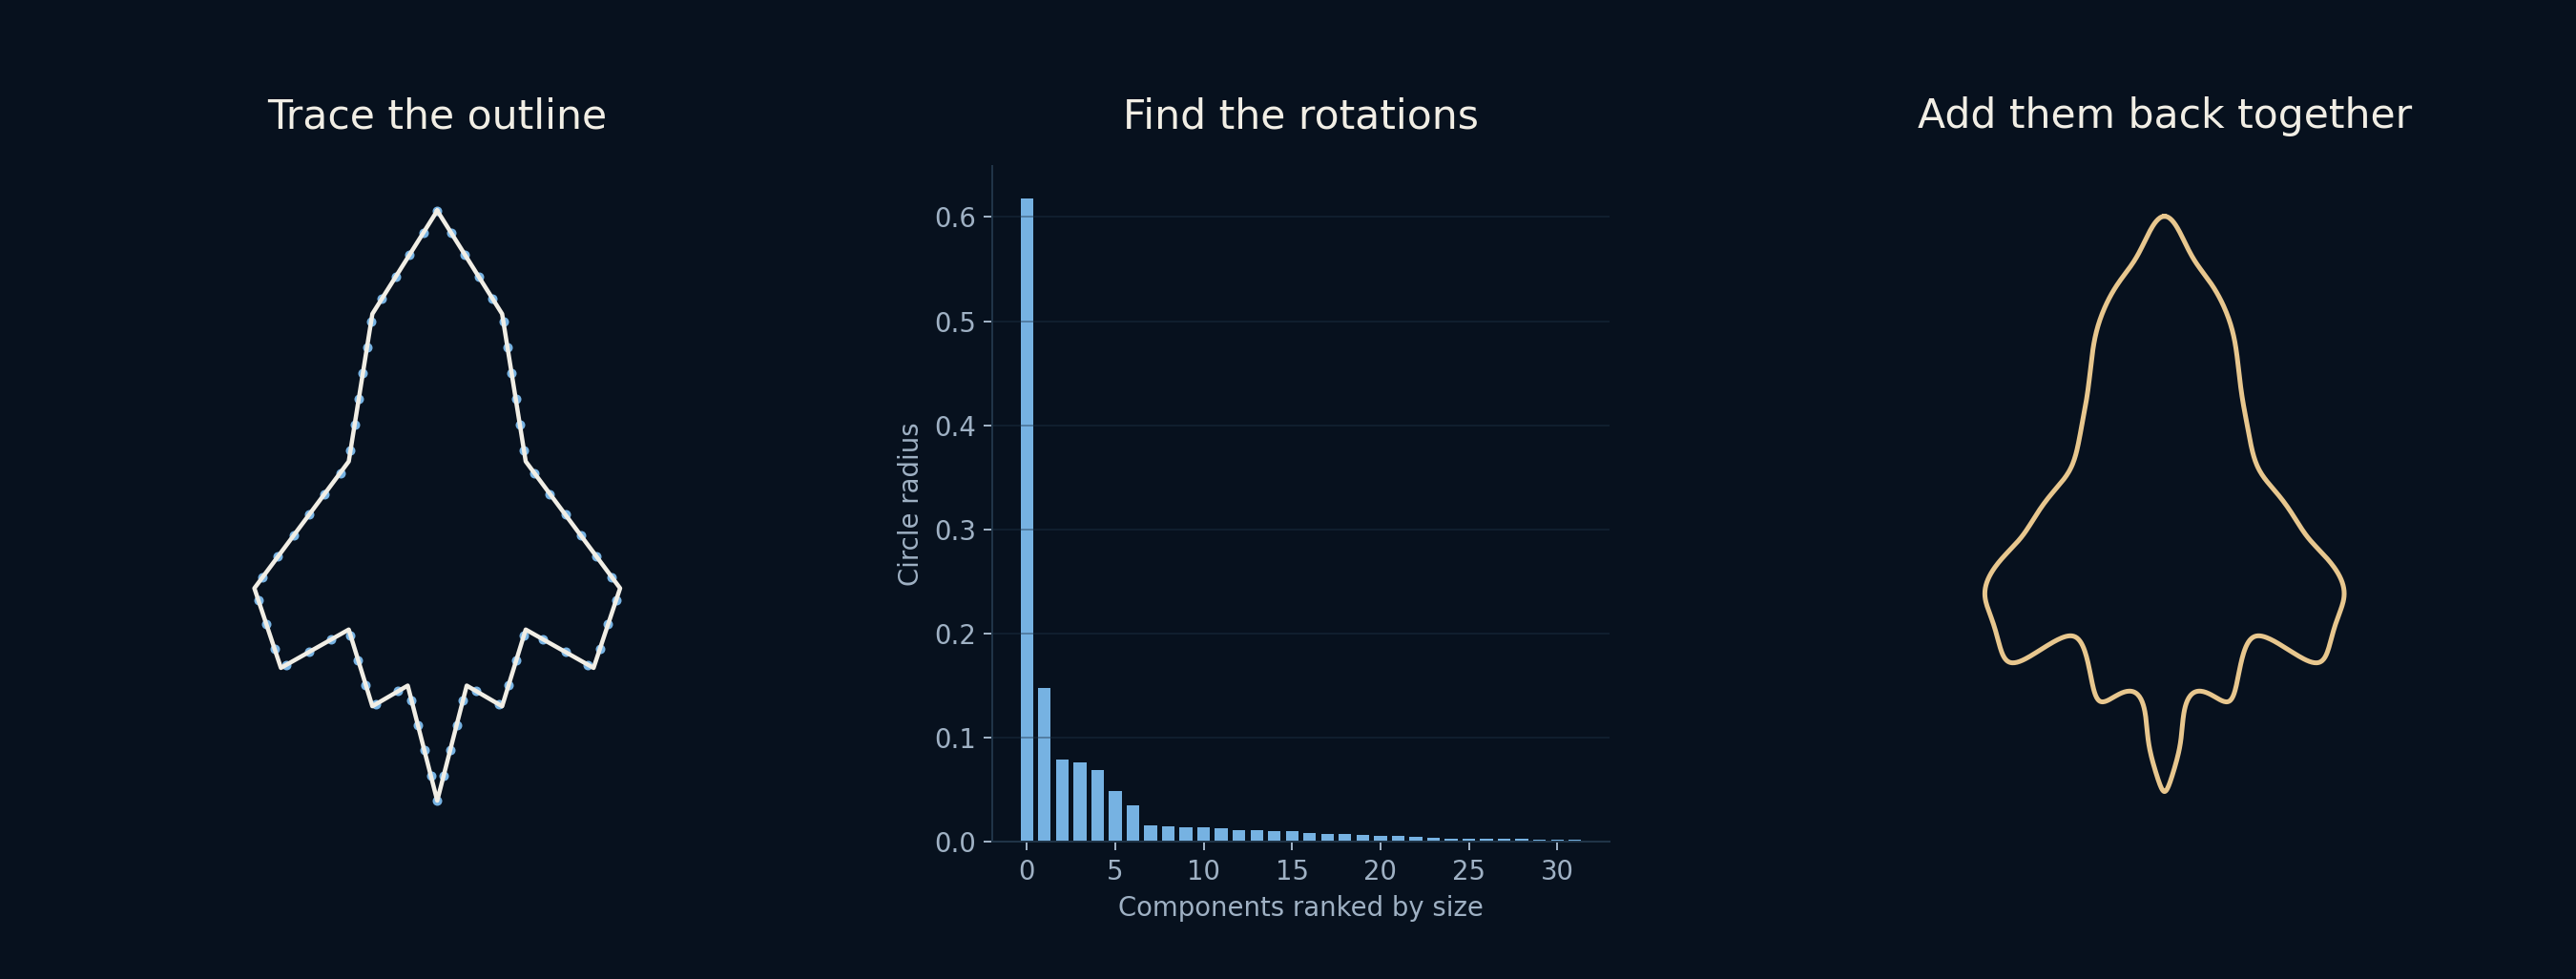
A circle’s radius sets how large its contribution is. Its frequency sets how many turns it makes while the pencil completes one trip. Its starting angle sets where in that rotation it begins. Some arrows rotate clockwise, others anticlockwise.
The arrows are joined tip to tail. The centre of each circle therefore rides on the end of the previous arrow. The small gold point is the end of the whole chain, not a dot independently following a hidden rocket outline.
One extra value places the chain on the page. It is the average position of the sampled outline, so it does not rotate. When this article says “32 circles”, that fixed centre is counted separately.
Eight circles suggest it. Thirty-two explain it.
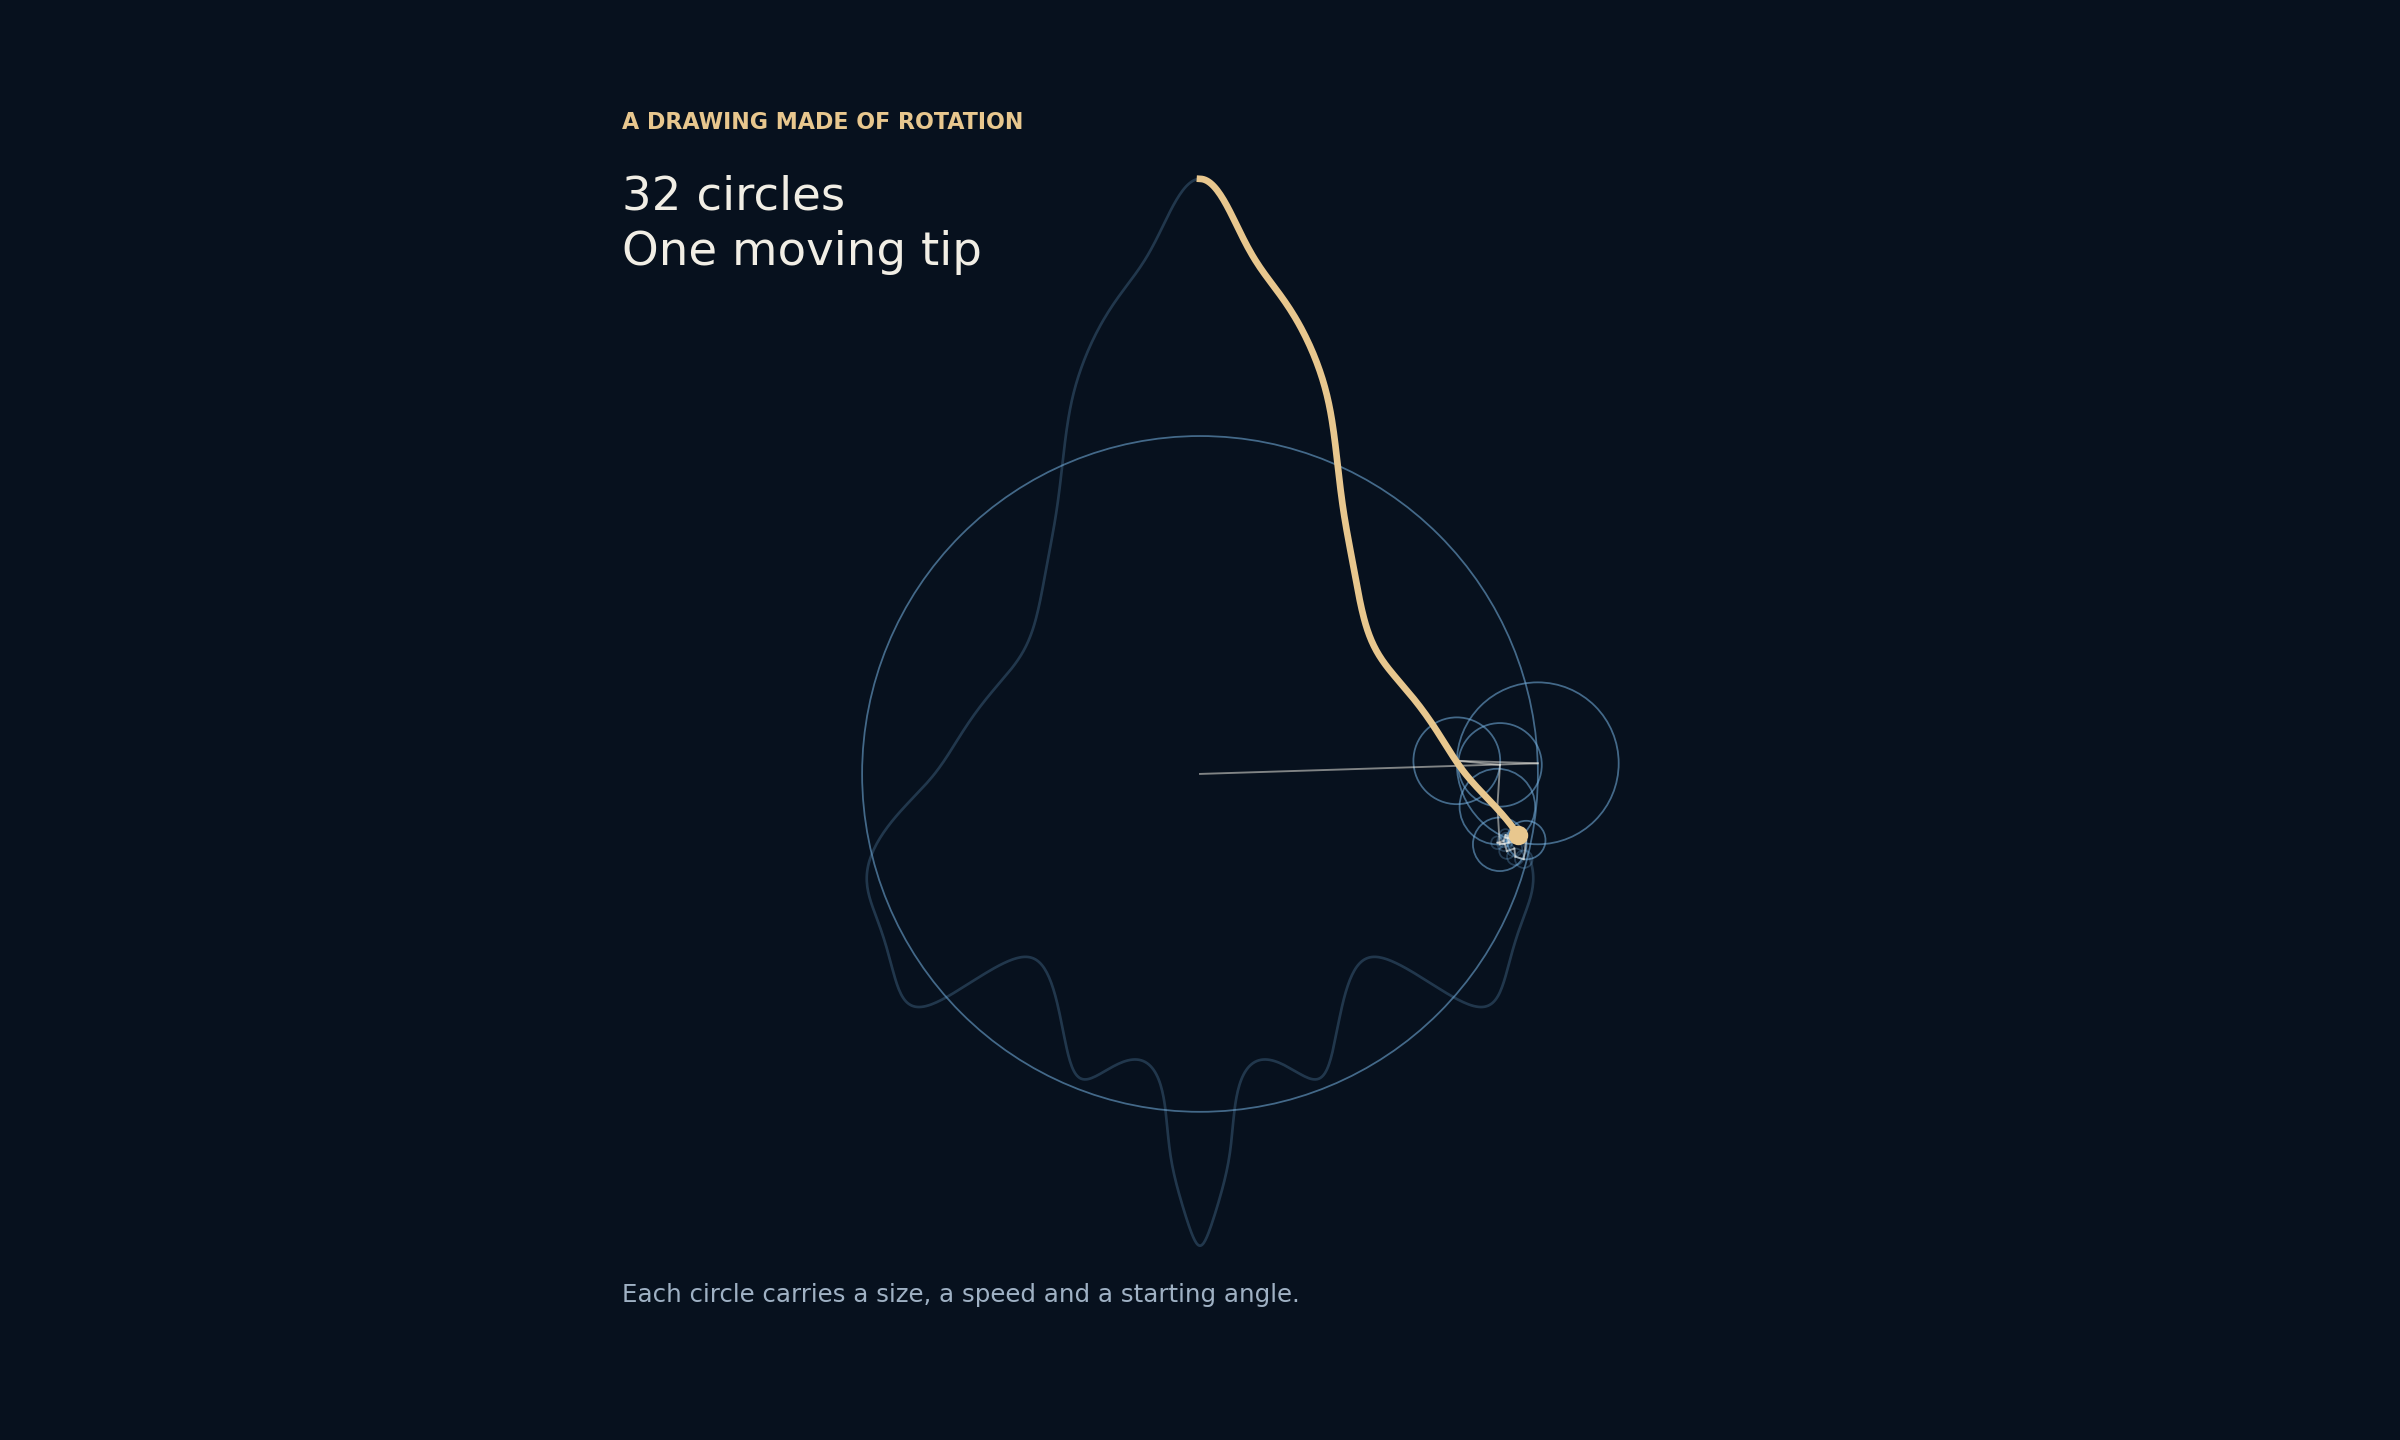
For this example, the starting shape is a deliberately drawn polygonal rocket, not a photograph. Its outline is sampled at 1,024 equally spaced positions along its length. An FFT then computes the rotating components.
Instead of keeping only the slowest rotations, this example keeps the largest contributions first. With eight circles, the rocket is recognisable but the fins are soft. At 32, most of its character is back. At 128, the sharp details are much closer to the original.
The interesting part is not that more circles produce more detail. It is how much of the drawing survives before the fine detail has been restored. The large rotations establish the shape; many smaller ones help negotiate the awkward corners.
The corners are where the work is
The yellow and pink areas below show larger positional differences for the 32-circle reconstruction. Notice the pointed nose, the fins and the tail. A straight side is relatively easy to follow. An abrupt change in direction asks more of a limited set of smooth rotations.
Average error alone can hide this. At 32 circles, the mean distance from the sampled outline is 0.232% of the original shape’s bounding-box diagonal. The largest distance is 1.314%. Those are answers to different questions: how far off is it on average, and how far off does it get at its worst?
The selected comparison levels improve here, but adding a circle is not a promise that every point or every error measure improves. Keeping the largest Fourier coefficients minimises squared error at the sampled positions for a given number of components. Mean distance and visual quality are not the same measure.
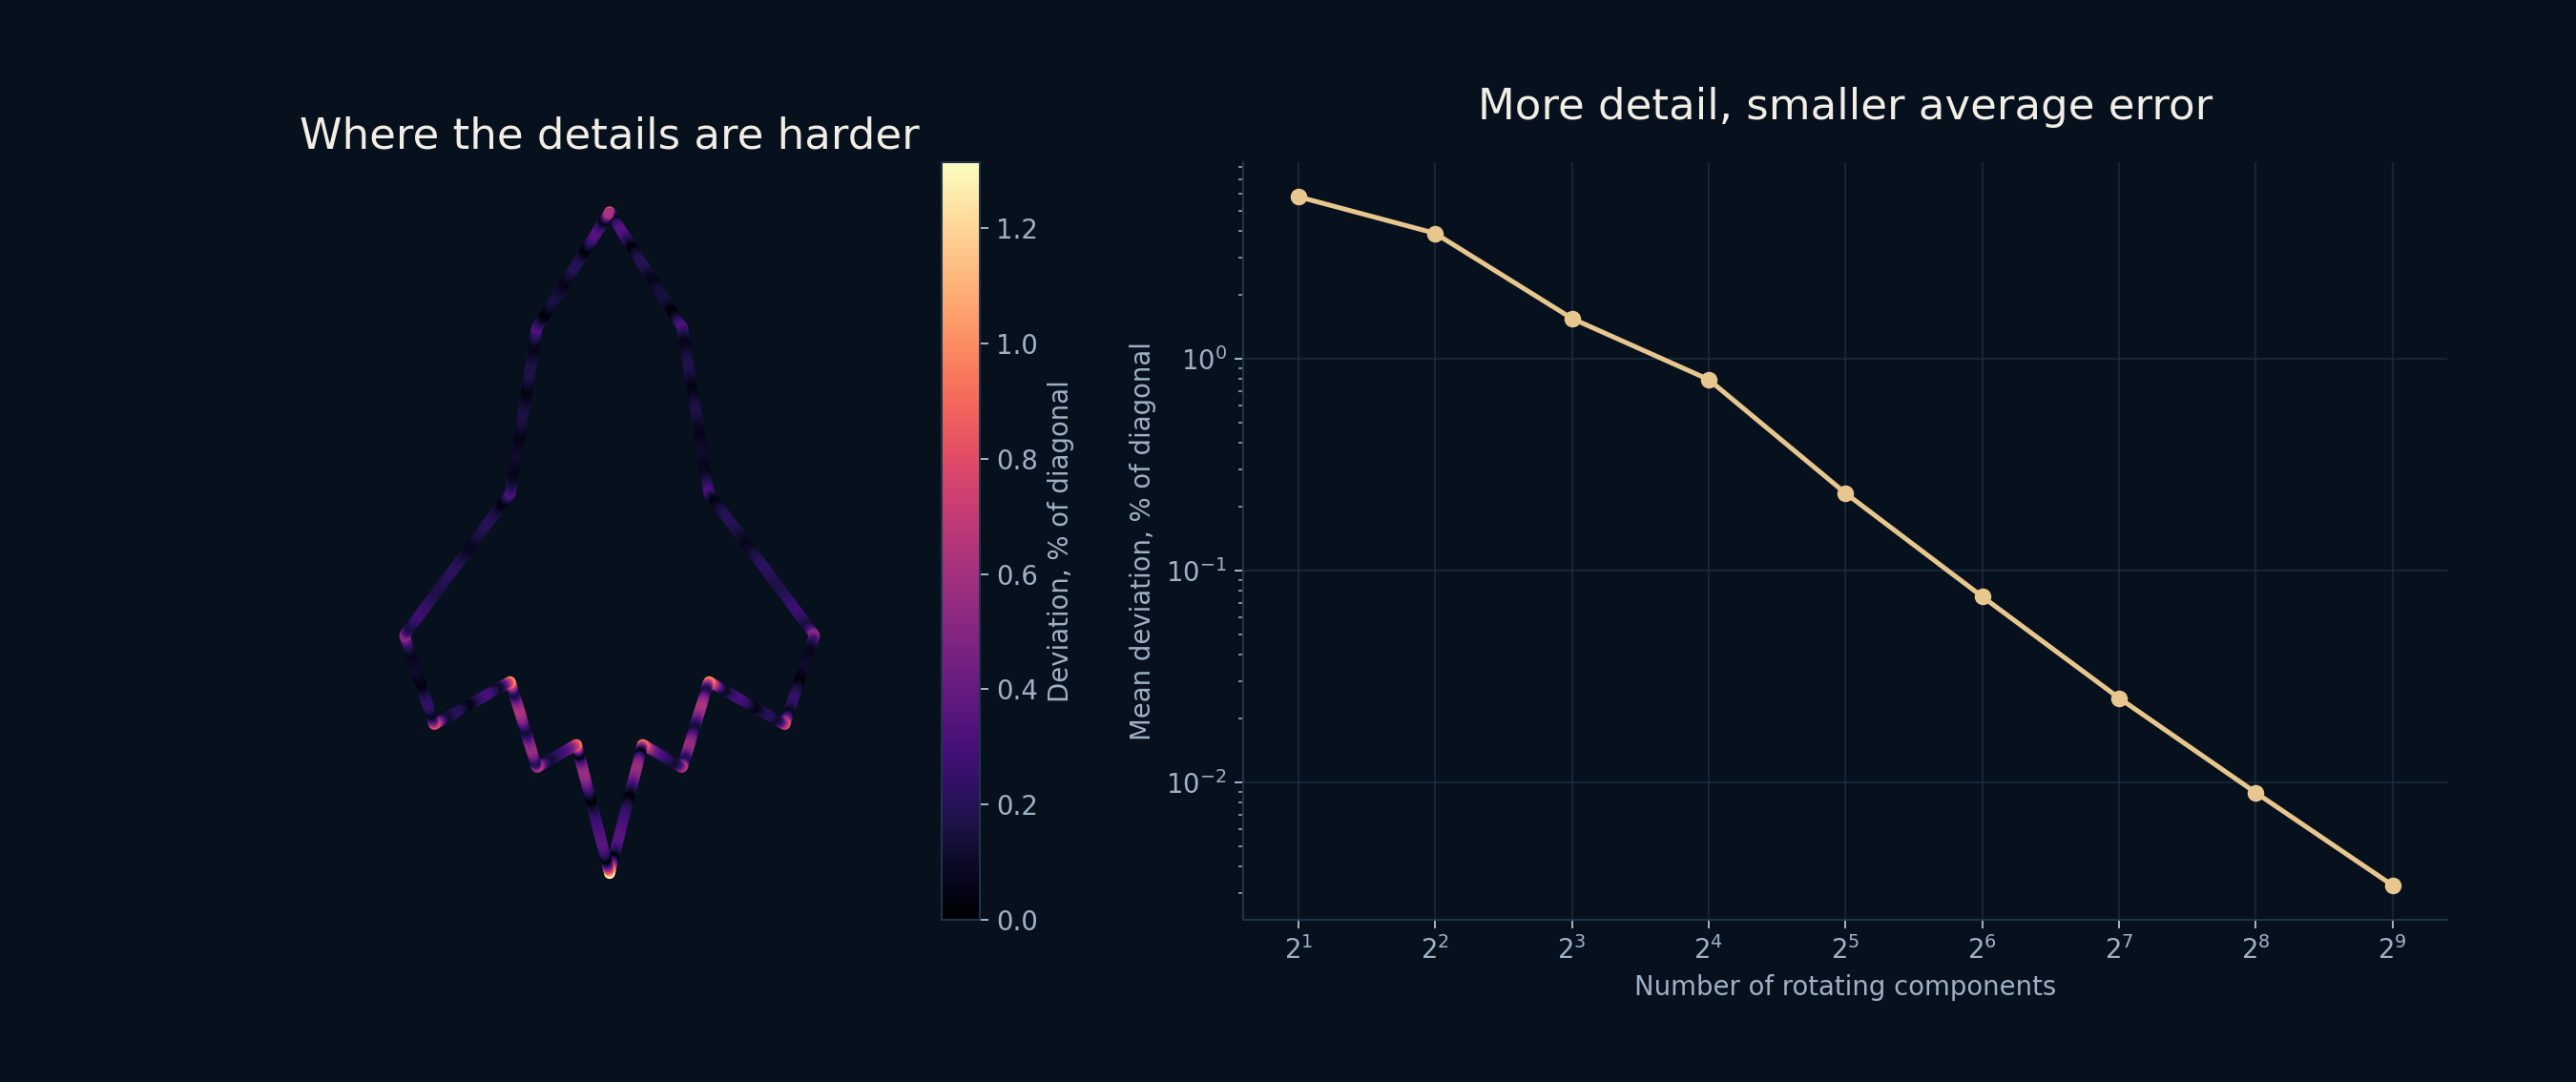
| Circles | Mean deviation | Largest deviation |
|---|---|---|
| 8 | 1.550% | 3.976% |
| 32 | 0.232% | 1.314% |
| 128 | 0.025% | 0.275% |
All distances are percentages of the original contour’s bounding-box diagonal, measured at the 1,024 sample positions. The fixed centre is additional.
Underneath the picture, a surprisingly small idea
The horizontal position becomes the real part of a complex number; the vertical position becomes its imaginary part. That sounds more mysterious than it is. A complex number is simply a convenient way to keep two coordinates together, and complex exponentials make rotation easy to express.
The reconstruction sums the selected rotating vectors at each moment. The fixed centre is added back at the end. The short excerpt below is the core of the calculation, not the full drawing or plotting program.
coefficients = np.fft.fft(points) / len(points)
frequencies = np.fft.fftfreq(len(points), d=1 / len(points))
selected = np.argsort(-np.abs(coefficients[1:]))[:32] + 1

rotations = coefficients[selected, None] * np.exp(
    2j * np.pi * frequencies[selected, None] * time[None, :]
)
path = coefficients[0] + rotations.sum(axis=0)Beautiful does not mean magical
It is tempting to call this “compressing a picture into 32 circles”. That would skip several important details. This experiment starts with a single closed contour, keeps numerical coefficients and does not compare the size of any real image files. It is not a replacement for JPEG, SVG or an AI image model.
It also does not recover an infinitely precise polygon from a finite number of samples. Using all of the components reproduces the 1,024 sampled positions to numerical precision; the path between those samples is a smooth periodic interpolation.
What I like about the result is simpler. Something that looks like a drawing can be understood as a carefully arranged collection of movements. The rocket was never hidden inside a circle. It was in the way the circles worked together.
Further reading
NumPy · Discrete Fourier Transform ↗NumPy · numpy.fft.fft ↗NumPy documents the transform convention and the FFT used here. The illustrations above come from the calculation described in this article.