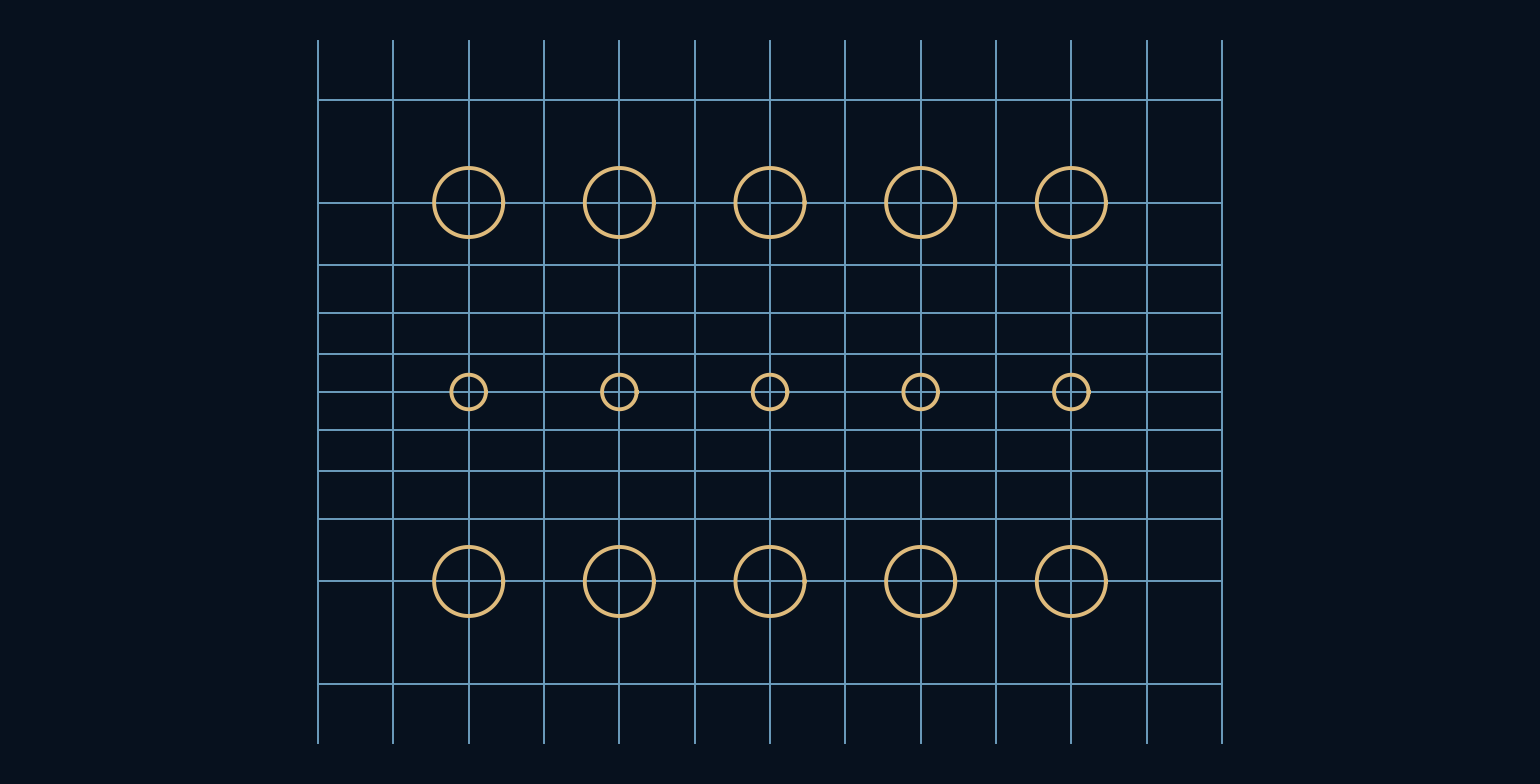
Why does a familiar world map make northern places look so large?
A flat map feels like a neutral window onto the planet, but flattening a curved surface is already an intervention. Coordinates have to move, and distances cannot all keep their original relationships. Two simple projections show the trade-off clearly: one keeps latitude lines evenly spaced, while the other stretches them toward the poles to preserve local angles.
A useful map is a chosen compromise.
Longitude becomes a misleading ruler
On a sphere, lines of longitude converge at the poles. A one-degree east-west interval therefore covers less ground at high latitude than at the equator. Its length is proportional to the cosine of latitude when measured along a parallel. A map that gives every longitude interval the same width must stretch those high-latitude distances.
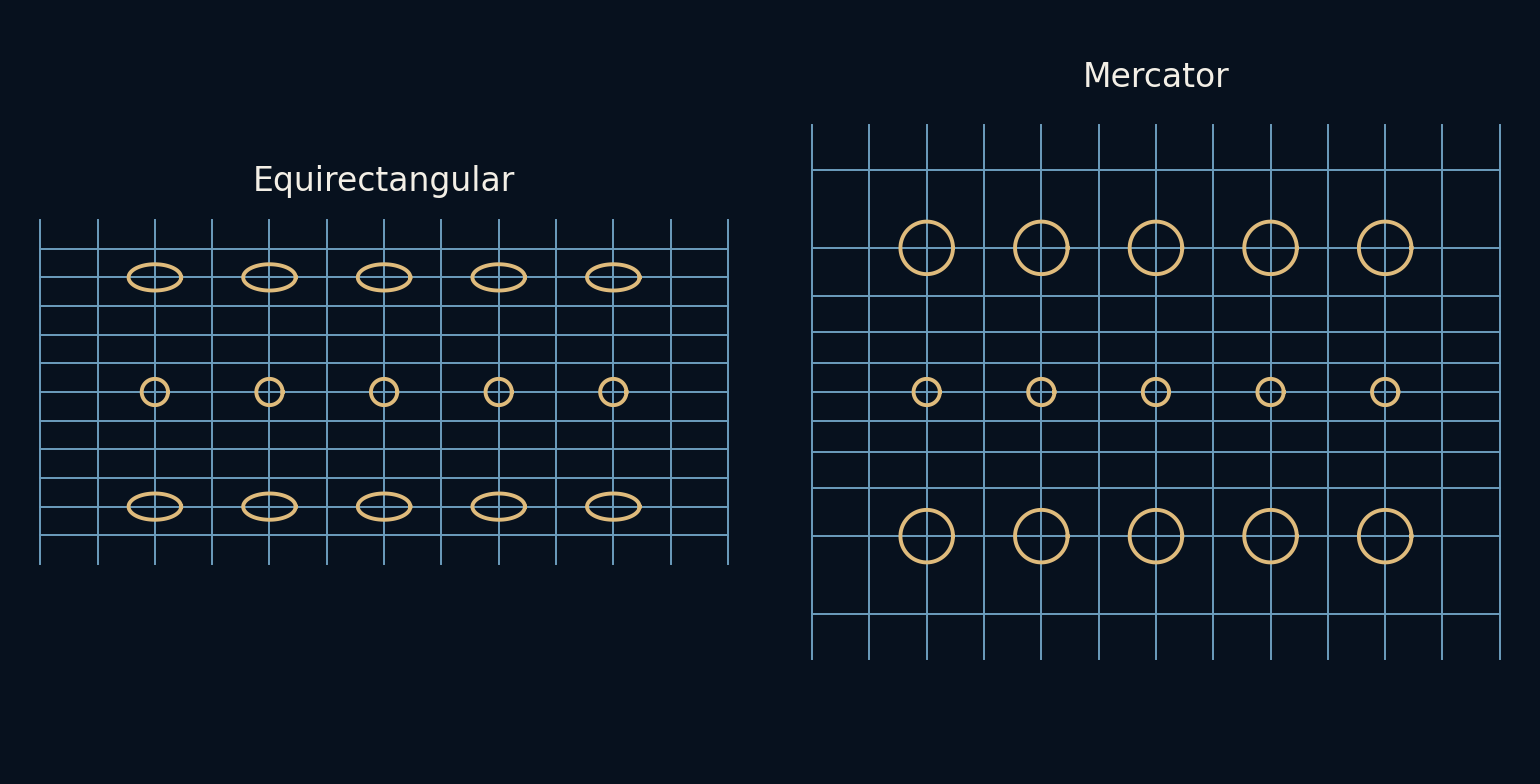
The equirectangular projection places longitude horizontally and latitude vertically, both with uniform spacing. It is convenient for storing a complete rectangular world image, but its east-west scale grows by one divided by cosine latitude relative to the equator. Its north-south scale remains one in our unit-sphere convention. Local shapes become wider toward the poles.
Mercator stretches the other direction too
The spherical Mercator projection uses the same longitude coordinate but changes the vertical coordinate to the logarithm of the tangent of 45 degrees plus half the latitude. This increasing vertical stretch matches the east-west stretch locally. Small shapes retain their angles because both directions have the same scale at a point.
That property is called conformality. It does not mean that a large country keeps its shape perfectly or that distances everywhere share one scale. Scale changes with latitude. The pole itself would require an infinite vertical coordinate, so an ordinary finite Mercator map must stop short of both poles rather than displaying the entire globe without a cut-off.
Area pays for the matched stretch
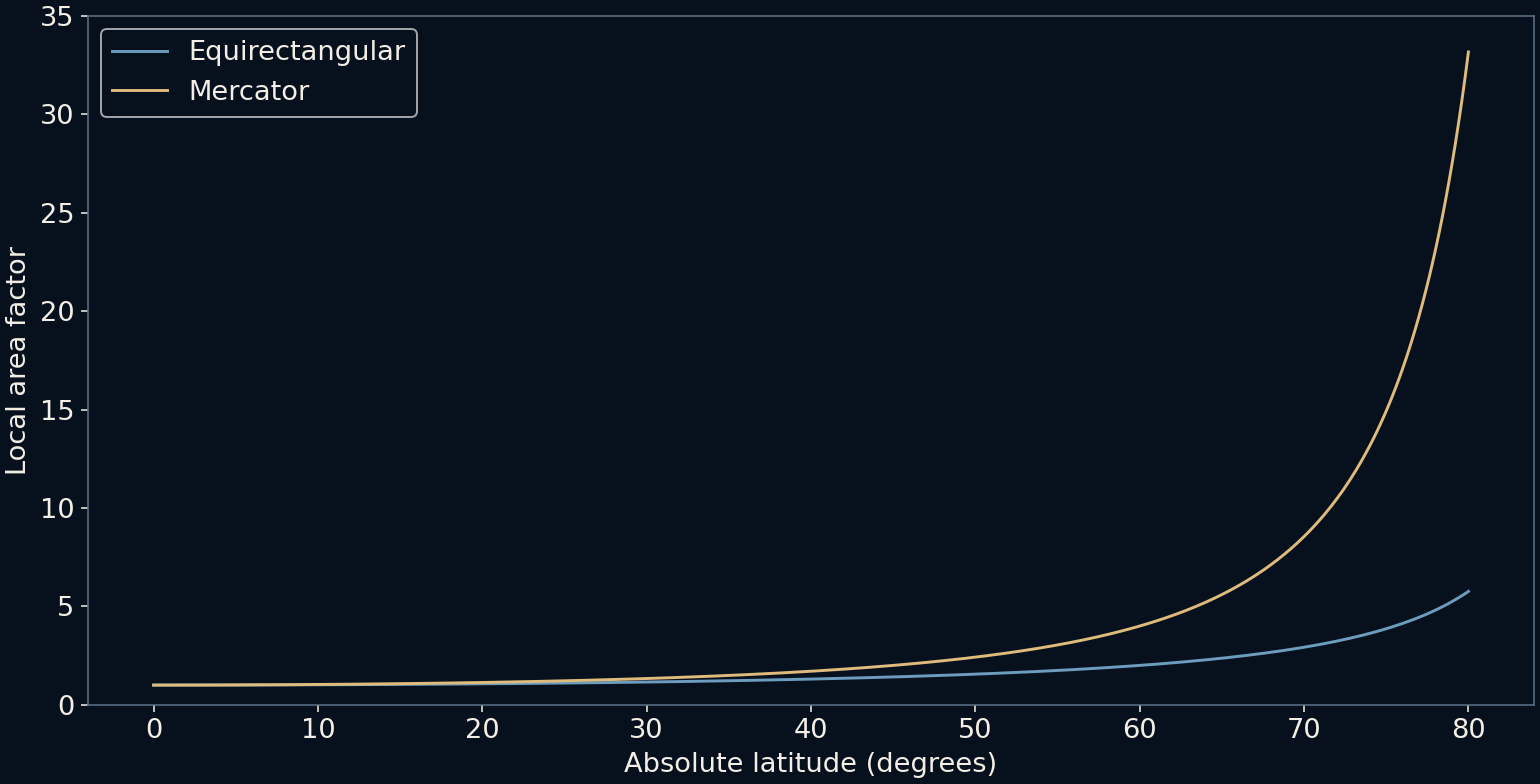
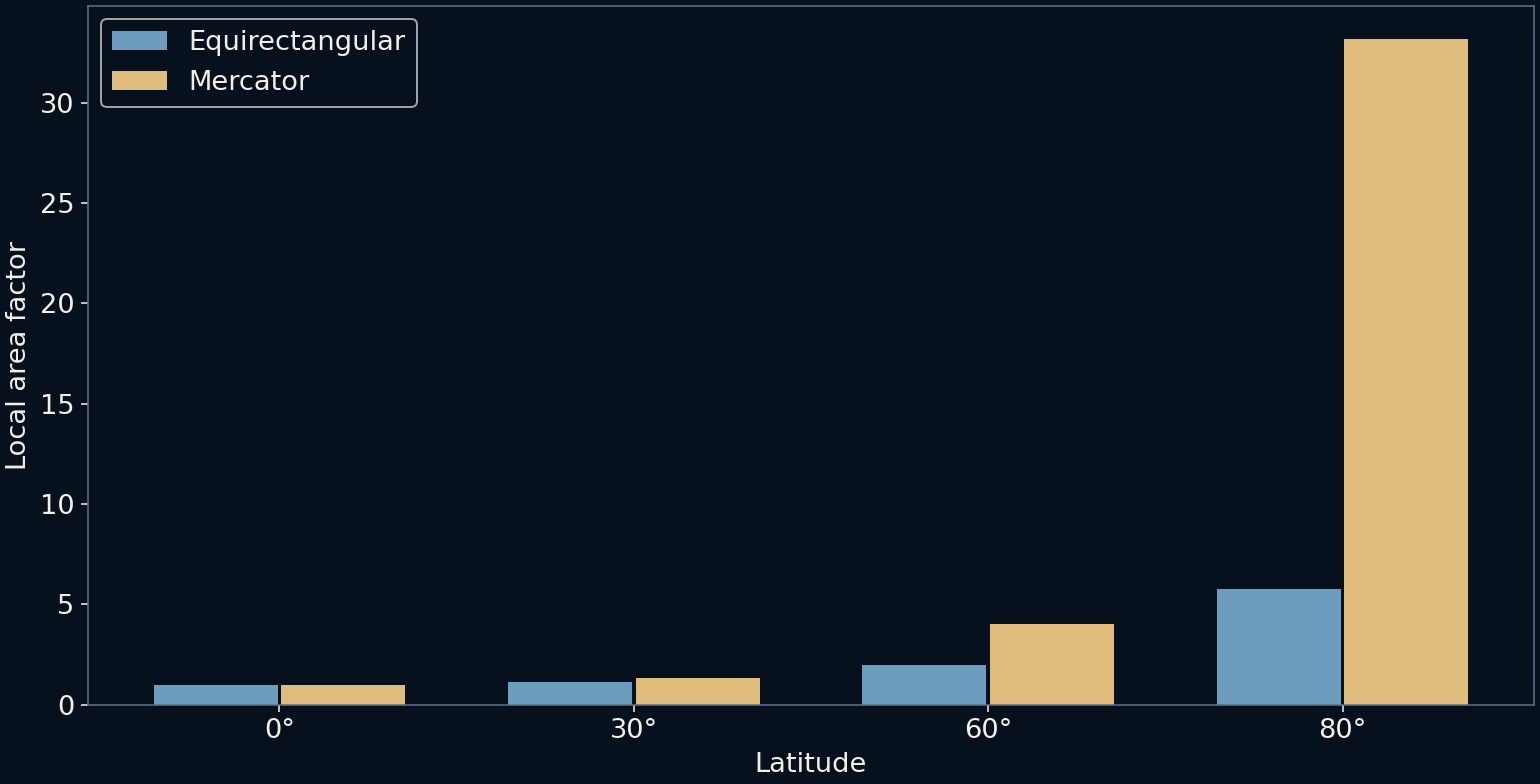
At 60 degrees latitude, cosine is one half. Mercator's local linear scale is therefore two in both principal directions relative to the equator. Multiplying the two factors gives an area factor of four. Equirectangular stretches only the east-west direction there, giving a local area factor of two while distorting shape.
At 80 degrees, the contrast becomes more dramatic. Mercator's local area factor is about 33.16; equirectangular's is about 5.76. These are ratios for tiny surface patches under our spherical formulas, not measured area ratios for specific countries. A large region spans different latitudes, so its total distortion requires integrating across that region rather than reading one number from its centre.
The circles are local explanations
The grid figure draws small scale markers at several latitudes. In the Mercator panel they remain circular while growing. In the equirectangular panel they widen into ellipses. The markers use the local differential scale at their centres, illustrating the behaviour of infinitesimally small circles rather than exactly projecting finite spherical circles.
This distinction matters because a picture can quietly overstate an approximation. The diagrams are intended to separate angle preservation from area preservation, not to supply survey-grade geometry. The common equatorial reference lets the two panels be compared meaningfully even though their vertical extents and treatment of high latitudes differ.
Choose the promise that serves the task
An equal-area projection preserves area relationships by accepting other distortions. A conformal projection preserves local angles. Some projections are designed to keep distances correct only from chosen points or along selected lines. No single flat representation of the whole sphere can preserve all distances, areas and angles simultaneously.
For comparing the sizes of regions, an equal-area map is often a more appropriate starting point. For a local engineering task, a suitable local coordinate system may keep distortion small within its intended region. For travel routing, the displayed map and the distance calculation need not use the same geometry. A screen ruler alone is not a dependable geographic measurement.
Read the projection as part of the argument
A map's frame, extent and projection influence what looks central, large or close. Those choices can be reasonable without being invisible. Before comparing regions by eye, check whether the projection preserves the property the comparison needs. The same geographic data can support quite different impressions on different grids.
The lesson is not to distrust maps indiscriminately. It is to read them with their transformation in mind. A good map gives up some promises to keep the useful ones. Understanding which promises were kept turns a familiar rectangular picture into a more honest tool for reasoning about a curved world.
Further reading
USGS: Map projections, a working manual ↗PROJ: Mercator projection ↗PROJ: Equidistant cylindrical projection ↗Original documentation and useful background.